Labeling Sensor Data Overview
A large part of building an AI application on the edge is being able to label your training data into meaningful events of interest for your model. The Data Studio makes this easy with several useful features including:
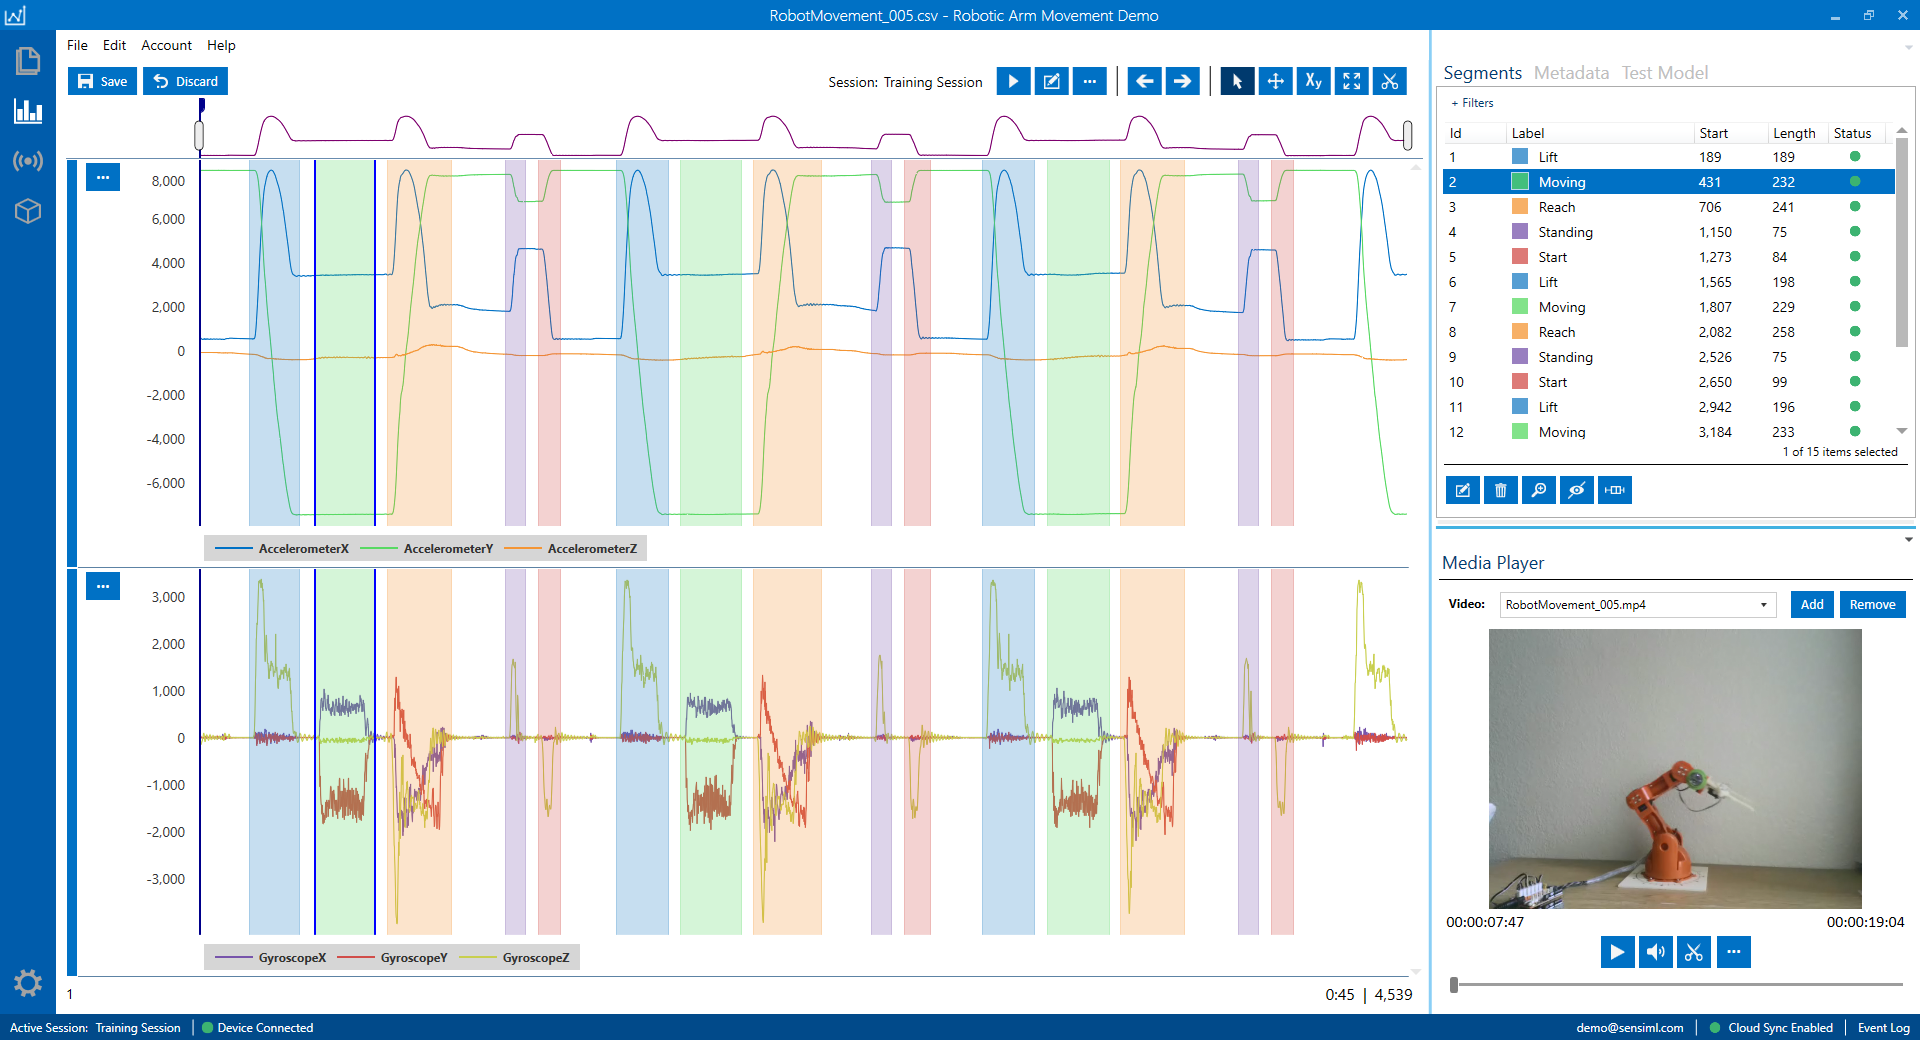
Easy-to-use graphing tools for labeling events of interest
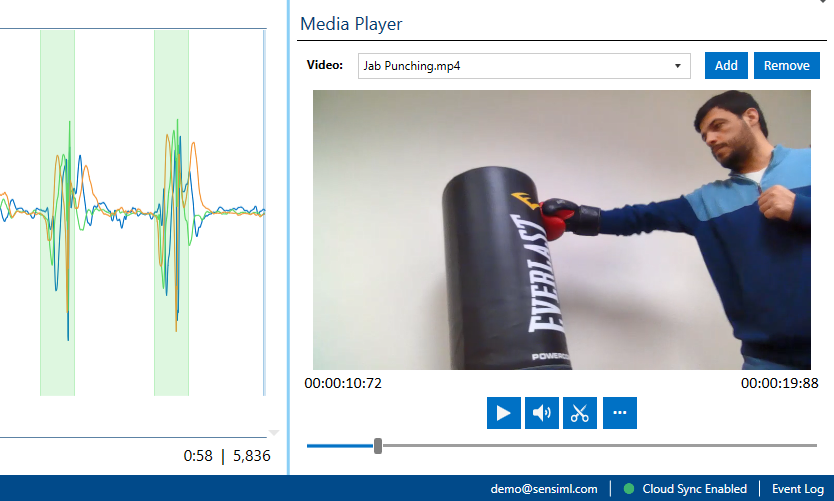
Media Player for playing video (MP4, MOV) or audio (WAV) files with your sensor data
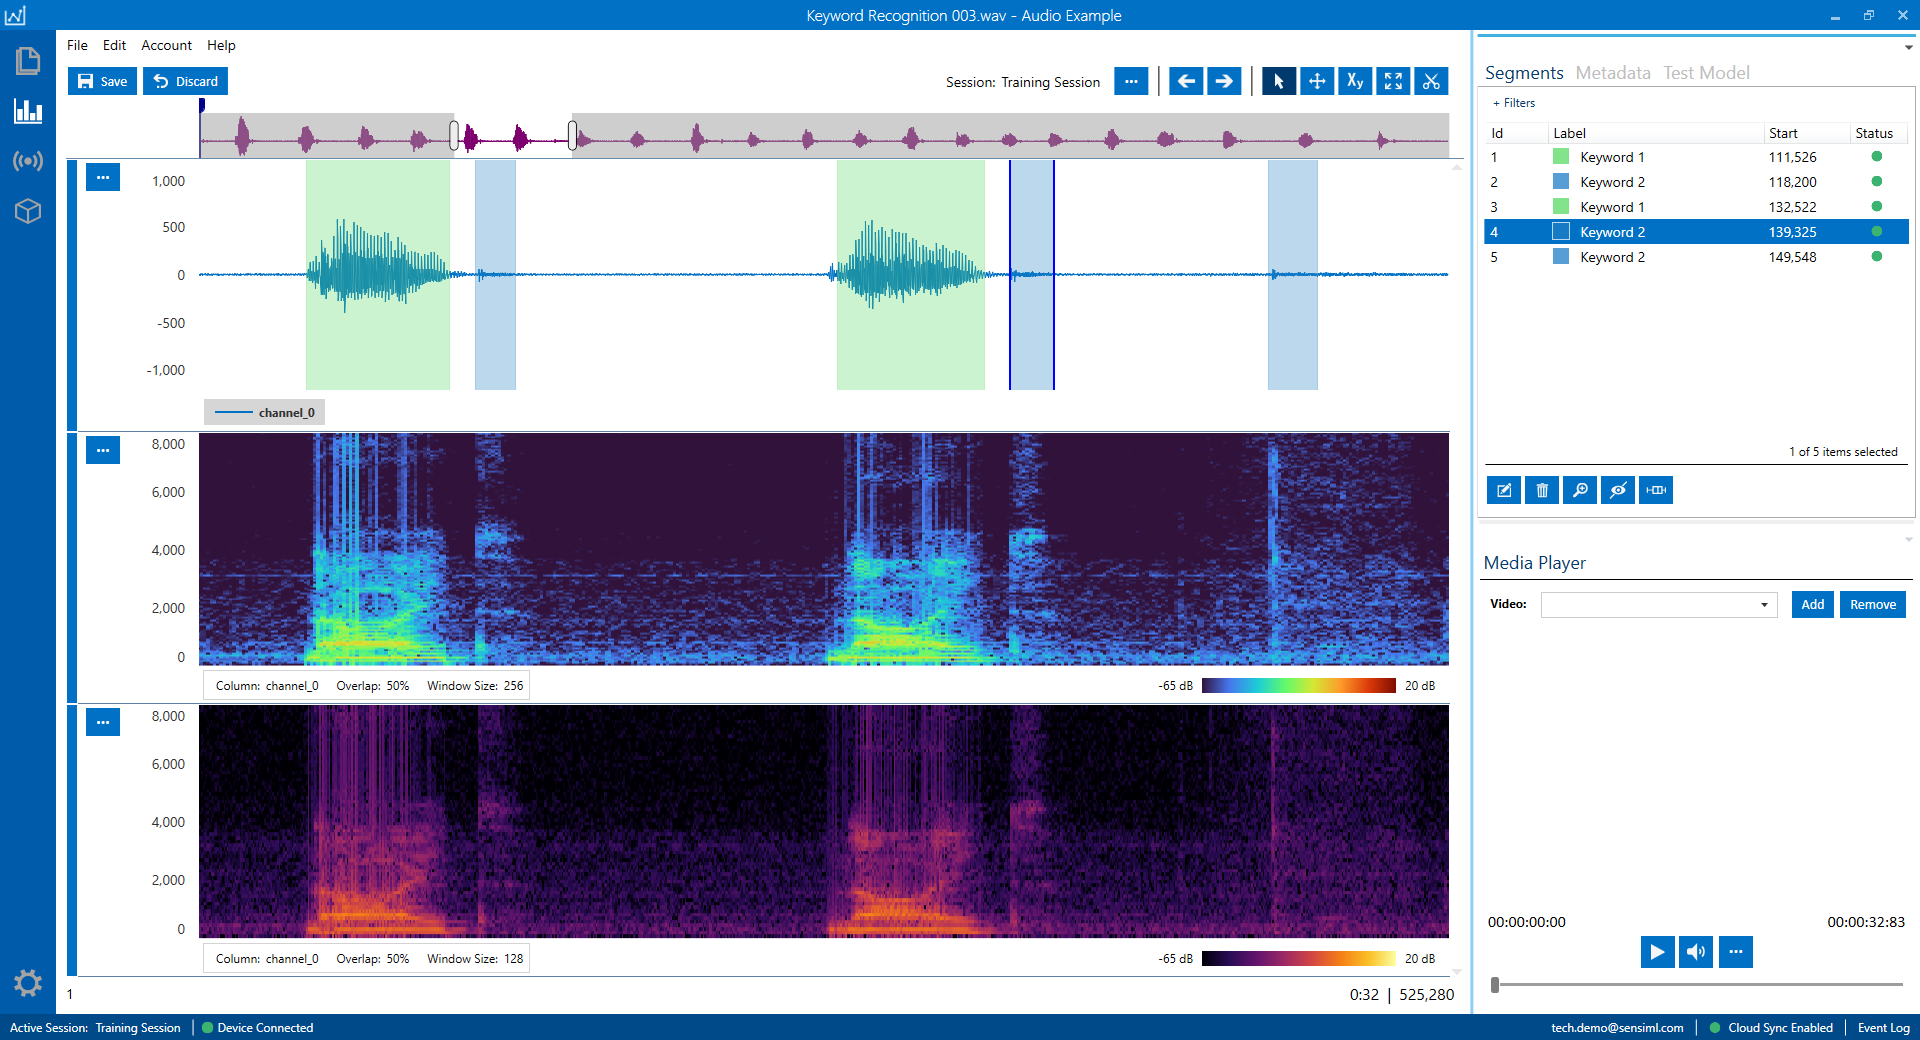
Spectrogram graphing tools
Automated tools for training events of interest on existing datasets
Project management tools for organizing and updating file information
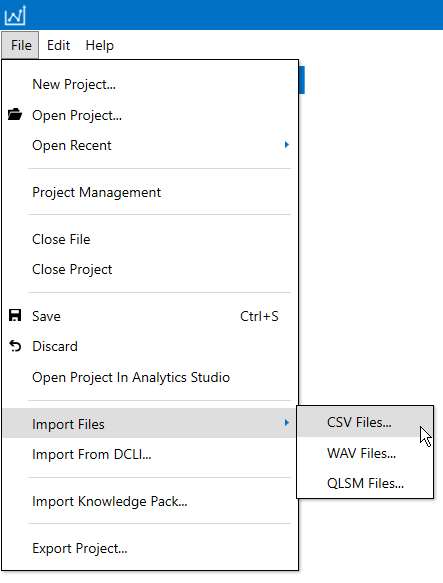
Import sensor data (CSV or WAV) from any external source
Let’s go over these features in more detail below.
Labeling Events of Interest
The Data Studio includes easy-to-use graphing tools for viewing, adding, and updating the events of interest in your training data. See more details on how to label your data in the Labeling Events of Interest Documentation.
Playing Video and Audio Files
The Data Studio can play WAV, MP4, and MOV files with your sensor data to make identifying your events of interest easier. See more details about the Media Player in the Playing Videos in the Data Studio Documentation
Spectrogram Graphing Tools
The Data Studio includes features for graphing spectrogram tracks in addition to your sensor time series data with flexible settings for setting the dB color range, frequency, overlap percent, and window size. The spectrogram graph makes it easier to identify important events of interest in your files, especially with audio or vibration sensors where it is common to have a lot of background noise.
Automated Tools for Training Events of Interest
The Data Studio includes two major features that automate the labeling process in your project.
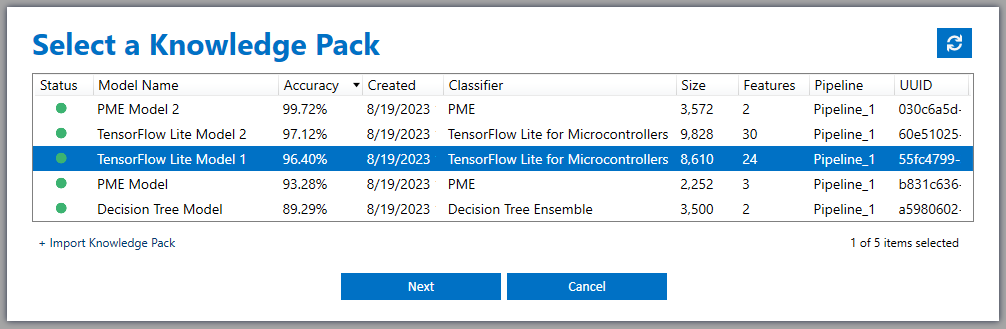
Using a model/Knowledge Pack from the Analytics Studio - The Data Studio can use a model you generated in the Analytics Studio on any file you’ve added to your project. This lets you see how your model will perform and gives you the option to save the results as new labels so that you can re-train a dataset.
Using a segmentation algorithm in an auto-session - The Data Studio can use a segmengation algorithm to automatically label your events of interest based on pre-defined parameters.
See more details on the automated labeling tools in the Data Studio in the Automated Labeling Tools Documentation
Project Management Tools
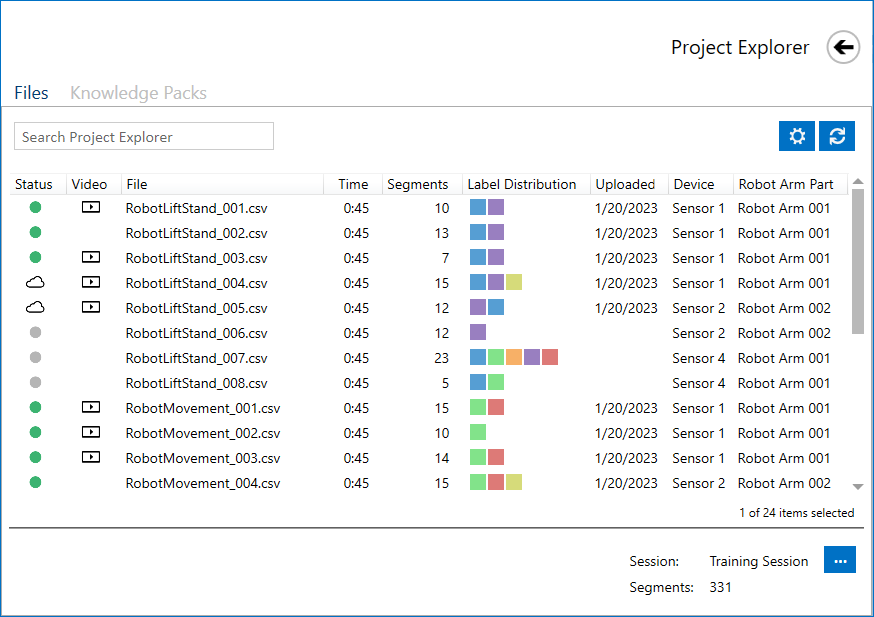
The Data Studio makes it easy to manage large projects with customized columns and filters for organizing your files and quick access tools for bulk updating your file properties in a project. See more details on the project management tools in the Project Management Overview Documentation
Import External Sensor Data
If you have your own tools for doing data collection, the Data Studio can import external sensor data files (CSV or WAV) from any source. This feature makes it so you can easily migrate your data into the SensiML Analytics Toolkit or continue to use your own tools for data collection without interrupting your workflow. See more details on this feature in the Importing External Sensor Data Documentation.