Fan State Condition Monitoring
Overview
In this tutorial we are going to build a predictive maintenance application for a fan that can run entirely on a cortex-M4 microcontroller using SensiML Analytics Toolkit. This tutorial focuses on predictive maintenance, but these technologies are applicable to a variety of domains where classifying time series sensor data is critical such as gesture recognition, activity recognition, sound classification, and keyword spotting.
Objective
Demonstrate how to collect and annotate a high-quality dataset of machine state for the fan using the SensiML Data Studio.
Build a data pipeline to extract features in real-time on your target device.
Train a Classification model using SensiML AutoML.
Convert the model into a Knowledge Pack and flash it to our target embedded device.
Perform live validation of the Knowledge Pack running on-device using the SensiML TestApp
Capturing Sensor Data
For every machine learning project, the quality of the final product depends on the quality of your curated data set. Time series sensor data, unlike image and audio, are often unique to the application as the combination of sensor placement, sensor type, and event type greatly affects the type of data created. Because of this, you will be unlikely to have a relevant dataset already available, meaning you will need to collect and annotate your own dataset.
To help you to build a data set for your application we have created the SensiML Data Studio, which we are going to use for collecting and annotating data for different fan states. If you are using the demo version of SensiML this project is already uploaded to the account as the Predictive Maintenance Fan Demo. Otherwise, the dataset for this tutorial can be downloaded at the link below.
Fan_State_Condition_Monitoring.zip
Unzip the files and import the dataset to the Data Studio by clicking
Import Project
Below you can see a quick demonstration of how the Data Capture lab enabled us to create an annotated fan state data set. In the next few sections, we are going to walk through how we used the Data Studio to collect and label this dataset.
Determining Events of Interest
Detecting and classifying events is ultimately the main goal of a time series application. In general, events fall into one of two types: continuous or discrete.
Continuous “Status” Events
Continuous events are events that happen over longer, gradual intervals or periods of time. Think of them like you are looking for the current status of the device. An example of this includes a motor fault detection sensor. The sensor will detect a continuous “Normal” status or in a continuous “Failure” status. Another example is a fitness wearable, where you classify the user’s activity status (Running, Walking, Resting).
Why is this important?
The type of event you are trying to detect will change the way you want to train your raw sensor data in the SensiML toolkit. In the SensiML Data Studio, you can put what we call Segment Labels on any portion of your sensor data. This allows you to accurately mark wherein the dataset each type of event is occurring.
Capturing environmental context
In addition to labels, it is also important to capture information about the environment. Capturing this contextual information enables you to build highly tailored models. Additionally, it makes it possible to diagnose why a model might be failing for subsets of your data.
For example, in this fan state dataset, we captured several contextual properties such as data collector, location, surface type, etc. Using these we would are able to build a model for fans that are on different types of surfaces as well as allowing us to understand if certain surfaces perform poorly.
You can capture the contextual information in the Data Studio using the metadata properties. Metadata are applied to the entire captured file, so when you are creating your data collection strategy think carefully about what information you may need. Metadata can be created as a selectable dropdown or manual entry allowing flexibility for your data collectors.
Capturing Data
It’s time to start collecting data. To collect data, we will go to the Capture mode in the Data Studio. The first thing we need to do is to set up the sensor that we would like to use. For this tutorial, we are using the ST Sensortile.box. There are several other sensors with built-in support. You can see more information about this board here.
We will configure this sensor to capture both IMU and Gyroscope data at a sample rate of 400Hz. In this tutorial, the data is stored directly to an internal SD card which we can then either stream out over a serial connection or transfer directly to our computer. You will see lower fidelity data streamed out live over the serial while the data collection is occurring.
After specifying our sensor configuration, we will connect to the device and be ready to record live data. We will use our laptop’s camera to record video, which we will sync up later.
The captured data will be saved locally to your computer as well as be synced up to the SensiML Cloud. This allows other members of your team who have permission to see and label your new captured file. Alternatively, if you already have a data collection method for your device, the Data Studio can import CSV and WAV files directly so you can still use it for annotating the data.
The video below walks through capturing and syncing the data to your cloud project with the Data Studio.
Annotating Events of Interest
The Data Capture lab has a manual label mode and an automatic event detection mode. For this tutorial, we are going to use manual event labels. We will label the regions where the fan is in a particular state. When we go to build the model, we will use a sliding window of 1 second to generate features to feed into our classifier. Right-click on the graph to create a segment around your event of interest. Next, click the edit button to select the label that is associated with that event. If you have collected your data set through other means, you can also import CSV or WAV files into the Data Studio.
The video below walks through how to label the events of a captured file in the SensiML Data Studio.
Building a Model
The SensiML Analytics Studio is where you can create a query to pull data into your model, build models using AutoML, validate model accuracy against raw signal data and finally download your model as firmware code for the target device. For the next part of the tutorial, you will need to log into Analytics Studio
Creating a Query
We will first start off by selecting the project we created with the Predictive Maintenance - Fan Demo project we created with the SensiML Data Studio. When you select the project, you will see an overview of all the captures, queries, pipelines, and models that are part of the project. We will start off by creating a query.
The query is used to select your sensor data from your project. If you need to filter out certain parts of your sensor data based on metadata or labels, you can specify that here.
Open the Prepare Data screen to create a query
Create a new query with the following properties:
* Query Name: 5 State
* Session: My Training Session
* Label: Label
* Metadata: Segment_UUID, Train
* Source: Select all columns
* Filter: [Label] IN [TAPPING, FAN OFF, FAN ON, MOUNT VIBRATION, BLADE OBSTRUCTION]
After clicking Save the Analytics Studio will count all the events of interest you have labeled in this project and graph them
The following video walks through logging into the Analytics Studio, selecting a project, and building a query.
Creating a model using SensiML AutoML
After you have created a query, we will use that to specify the data we input into the machine learning model. The models created in AutoML consist of signal preprocessing, feature extraction steps, and a classifier.
AutoML is used to create a set of models within the desired statistical (accuracy, f1-score, sensitivity, etc.) and classifier size. As the algorithm iterates each optimization step, it narrows downs the searching space to find a desired number of models. The optimization terminates when the desired model is found or the number of iterations reaches the max number of iterations.
We take advantage of dynamic programming and optimizations for training algorithms to speed up the computation. This makes it possible to search for large parameter spaces quickly and efficiently. The results are ranked by the fitness score which considers the model’s statistical and hardware parameters.
There are several preprocessing steps as well as feature generator families that can be specified in the advanced settings. These settings can improve the model accuracy depending on your application. For this use case, we want to remove the mean from each of the input channels. You can also select the type of validation method to use along with the types of feature families to search over.
Once the models have been generated, you can explore the details of the top five candidate models in the explore models tab. In this tab, there are visualizations and information about the models including, features, confusion matrix, model hyperparameters and the Knowledge Pack training and inference pipeline.
The following video walks through both building and exploring models in the SensiML Analytics Studio.
Testing a Model in the Analytics Studio
Before you flash the model to the device, you can test the model using the Test Model tab. You can test against any of the captured data files. To do this:
Go to the Explore Model tab of the Analytics Studio.
Select the pipeline you built the model with.
Select the model you want to test.
Select any of the capture files in the Project.
Click RUN to classify that capture using the selected model.
The model will be compiled in the SensiML Cloud and the output of the model will be returned. The graph shows the segment start and segment classified for all the detected events.
Running a Model On Your Device
Downloading the Knowledge Pack
Now that we have validated our model it is time for a live test. To build the firmware for your specific device go to the Download Model tab of the Analytics Studio. We support the compiled binaries for our target platforms which include fully configured sensors and classification reporting over BLE. We also provide compiled libraries that can be integrated into your application. For enterprise customers, you will have full access to the SDK and can take the compiled models and modify or optimize them for your target devices.
If you are using the community edition of SensiML you can download the firmware binary or library for your device. Head over to the Analytics Studio to download your model and flash it to the device. To download the firmware for this tutorial
Go to the Download Model tab of the Analytics Studio
Select the pipeline and model you want to download
Select the HW platform ST Sensortile.box
Select Format Binary
To turn on debug output check Advanced Settings and set Debug to True
Click on Output and add BLE as an option as well which enables UART output over serial
Click Download and the model will be compiled and downloaded to your computer.
Unzip the downloaded file and flash to your device.
After downloading the Knowledge Pack, follow the instructions associated with your firmware for flashing it. We have flashing instructions for our supported boards here.
Live Test using SensiML TestApp
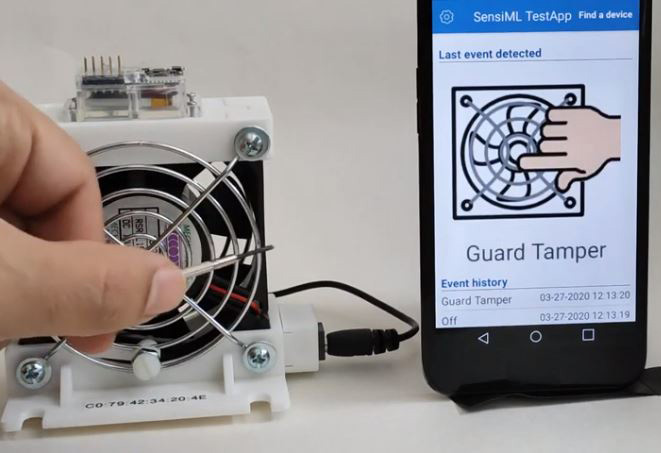
Being able to rapidly iterate on your model is critical when developing an application that uses machine learning. To facilitate validating in the field, we provide the SensiML TestApp. The TestApp allows you to connect to your microcontroller over Bluetooth and see the classification results live as they are generated by Knowledge Pack running on the microcontroller.
The TestApp also has some nice features, such as the ability to load the class-map, associate images with results, see the history, and apply a majority voting post-processing filter. Documentation on how to use the TestApp can be found here. In this example, we have loaded the TestApp with images of the different machine states to detect. As the machine changes state, the results will be displayed in the TestApp along with the picture and class name.
Summary
We hope you enjoyed this tutorial using the SensiML Analytics Toolkit. In this tutorial we have covered how to:
Collect and annotate a high-quality data set
Build a query as input to your model.
Use SensiML AutoML to search for an edge optimized model.
Use the SensiML Analytics Studio to test the model offline.
Use the SensiML TestApp to perform live validation of the model running on the device.
For more information about SensiML visit our website. To work with us to enable you to build your application get in touch with us.
SensiML
SensiML enables developers to quickly and easily create machine learning models that run locally on resource-constrained edge devices. SensiML SaaS provides an end-to-end solution from collecting and annotating a high-quality sensor time-series data set, to analyzing and building data models using AutoML, and finally generating firmware that will run on your target device.