Labeling Your Data
Next, we are going to go over how to label events of interest in the Data Studio. How you do this depends on the type of event you are detecting (described in Data Collection Planning). First let’s see how to open a file.
Viewing Your Sensor Data Files
Open your project in the Data Studio
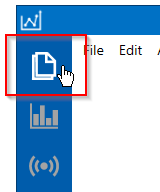
Click the Project Explorer button in the top left navigation bar
Double-Click on a file name to open the file
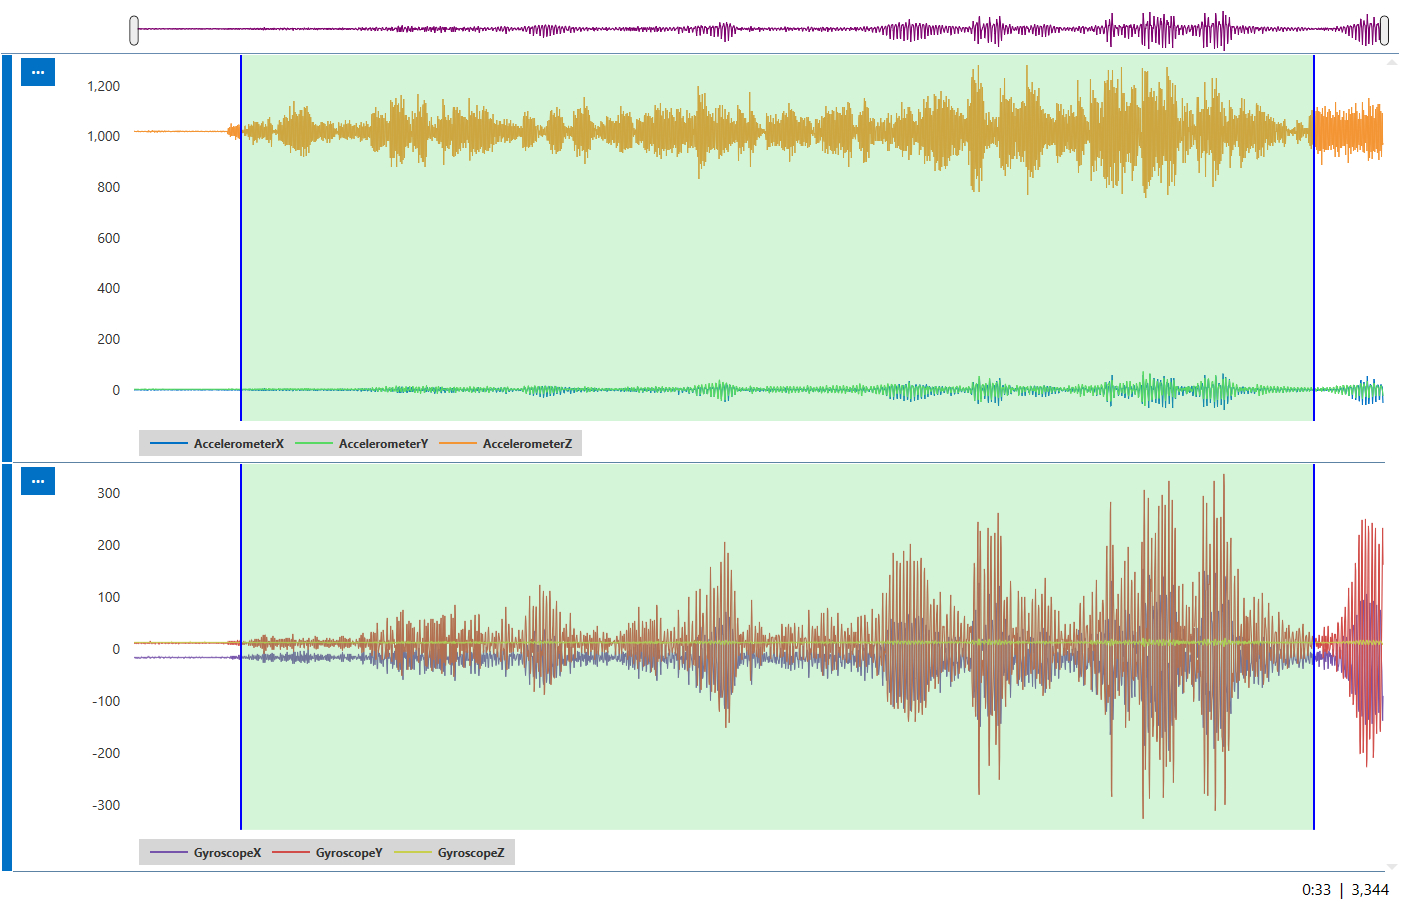
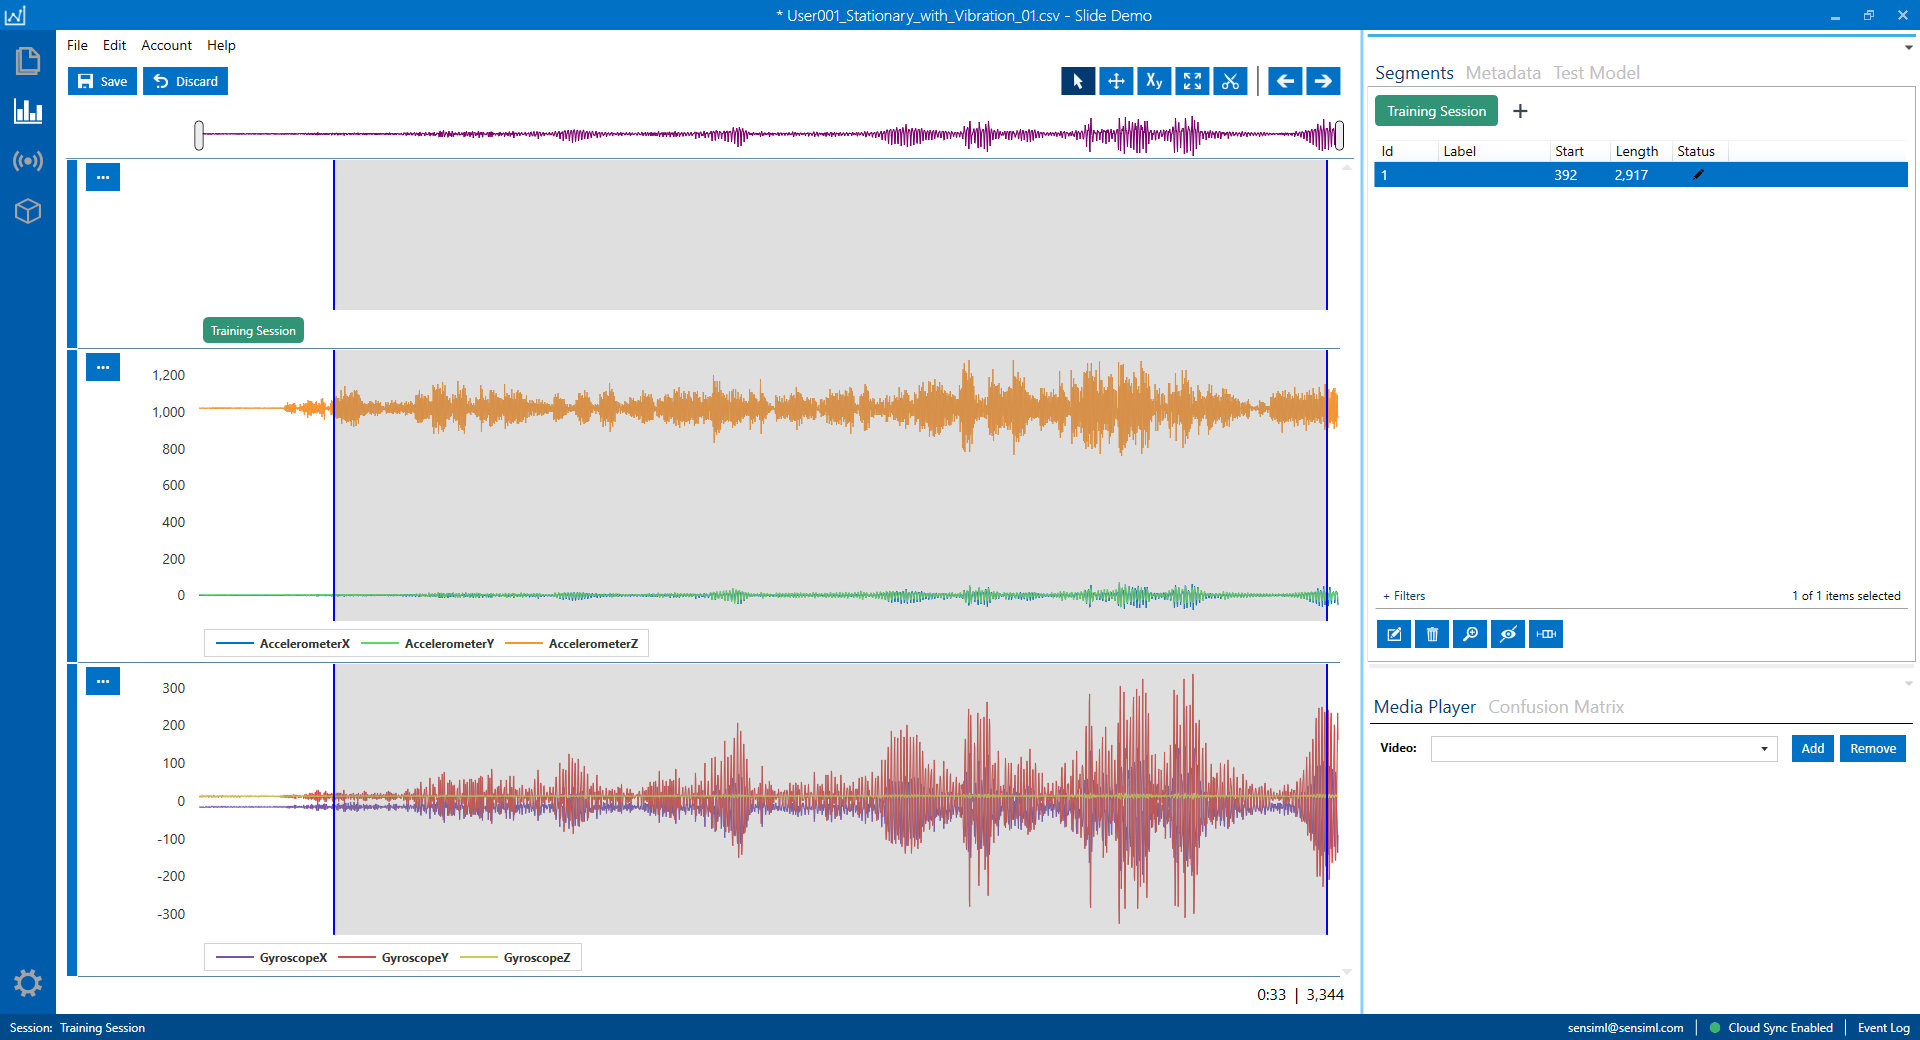
Depending on the project you have loaded, the file will open and look similar to this
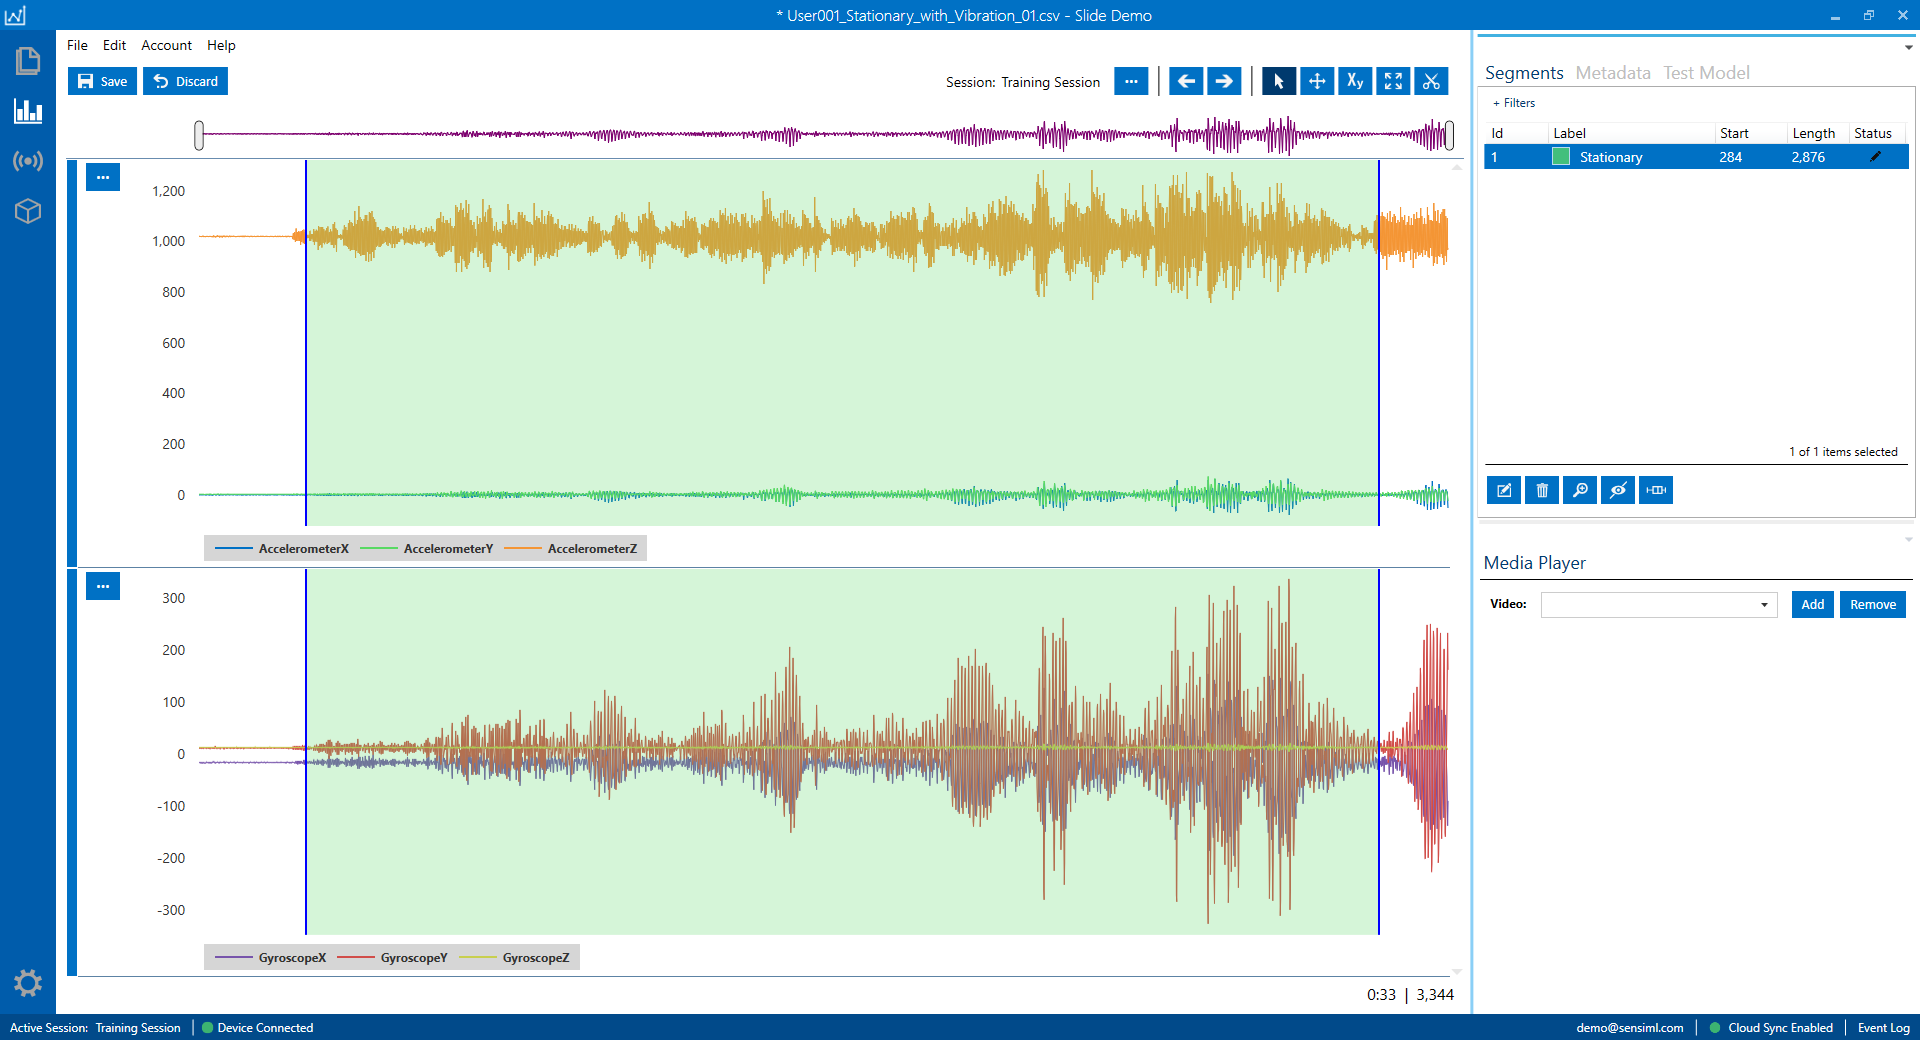
If you are working with a project that has Accelerometer and Gyroscope data, you will notice the Data Studio has split the data into two tracks. These tracks can be customized to display as many sensor columns as you need.
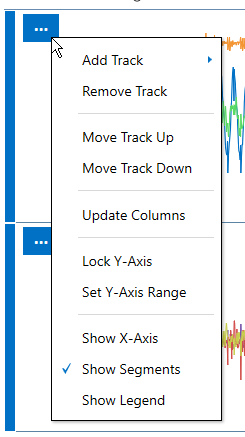
(Optional) Click on the track menu options to view options for the way your tracks are displayed. You can also add more tracks, update columns, or remove tracks. This is a powerful feature that allows you to visualize your data easier.
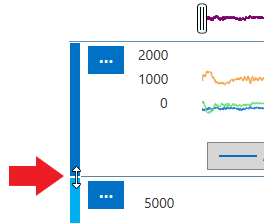
(Optional) Click and drag the area between tracks to adjust a track height
Segments
Segments are how we define where an event is located in your sensor data file. A segment is displayed as a transparent label within the graph of your sensor data. See a screenshot of a segment below.
Sessions
A session separates your labeled events (segments) into a group. Every segment is inside a session. Sessions allow you to work on multiple branches of the same dataset. Sessions can be useful when collaborating with a team or if you want to experiment with different segmentation methods on the same dataset.
Managing Sessions
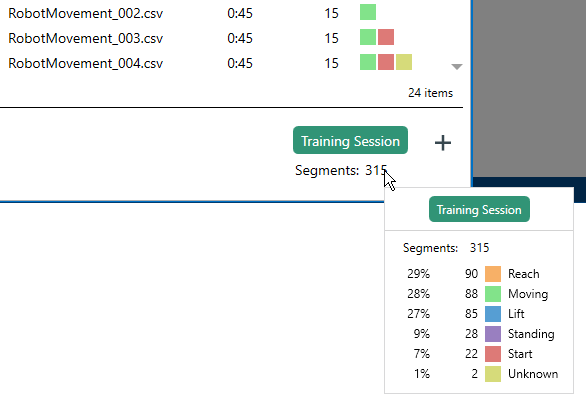
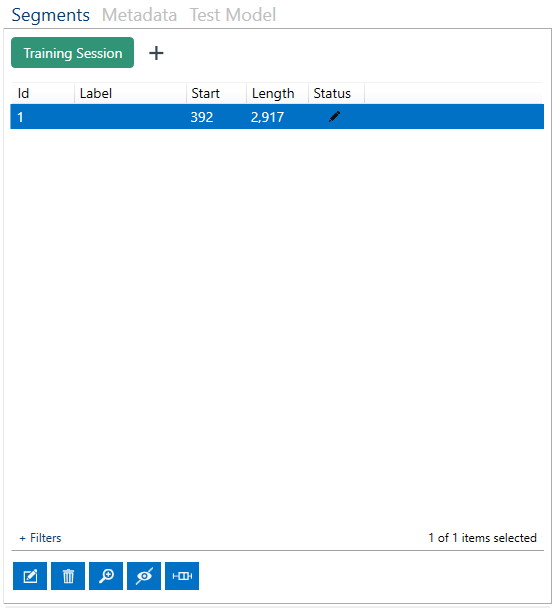
You can see the session you are currently working in and how many segments are in that session at the bottom of the Project Explorer. Hover over the segments to see your session label distribution
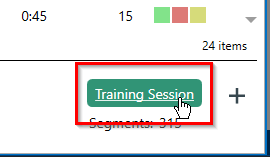
Open the session management screen from the Project Explorer by clicking on the session name
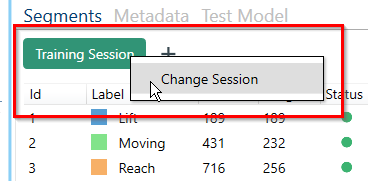
Alternatively, if you have a file open you can switch sessions by right + clicking on the session name in the Segments control
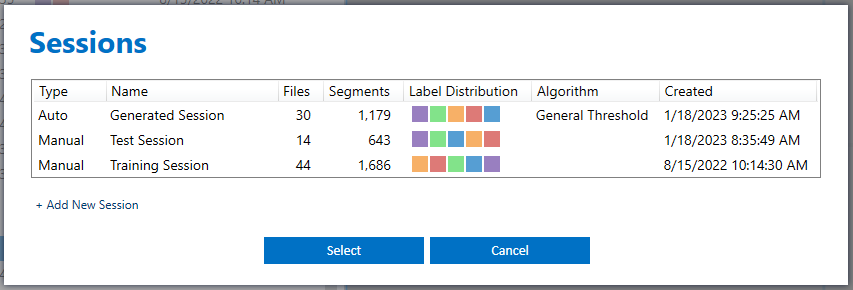
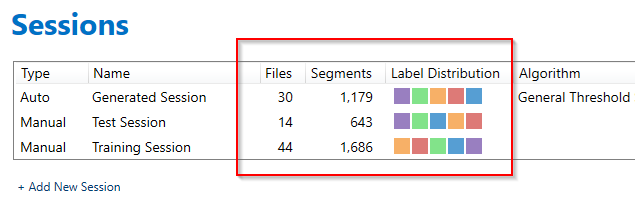
In the session management screen you can see details about your session like how many files have been labeled and how many segments are in each session
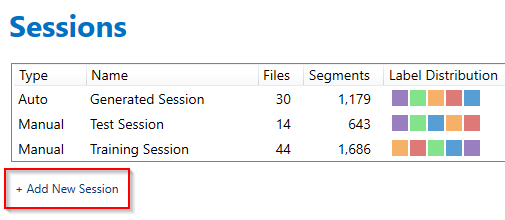
You can add new sessions by clicking + Add New Session
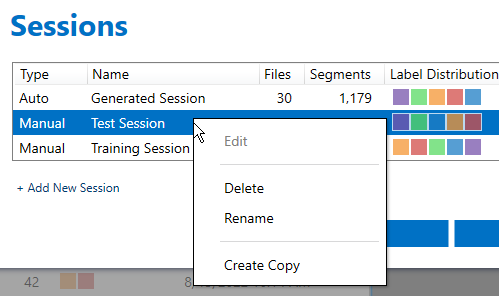
You can Edit, Delete, and Copy sessions by right-clicking on any session
Adding Segments to a Session
Open a file from the Project Explorer
Next, we will add a segment to identify our event of interest. To do this, move your mouse onto the graph of your sensor data and right-click + drag your mouse over the area that you want to label as an event. This will place a new segment in the file
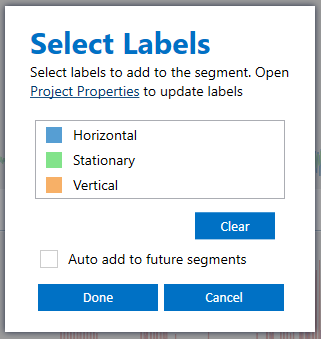
Label your segment with an event by clicking the Edit button or use the keyboard shortcut Ctrl + E
Select a label and click Done
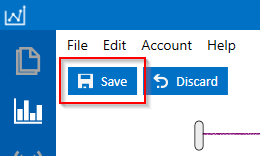
Click Save. This will save the segment to your session and upload it to the cloud
Add segments to all of the files in your project. The Slide Demo dataset has already been labeled, so if you are using this dataset you can move to the next step