Release Notes
Current Release
2024.1.0 (02/15/2024)
What’s New
Minor Features
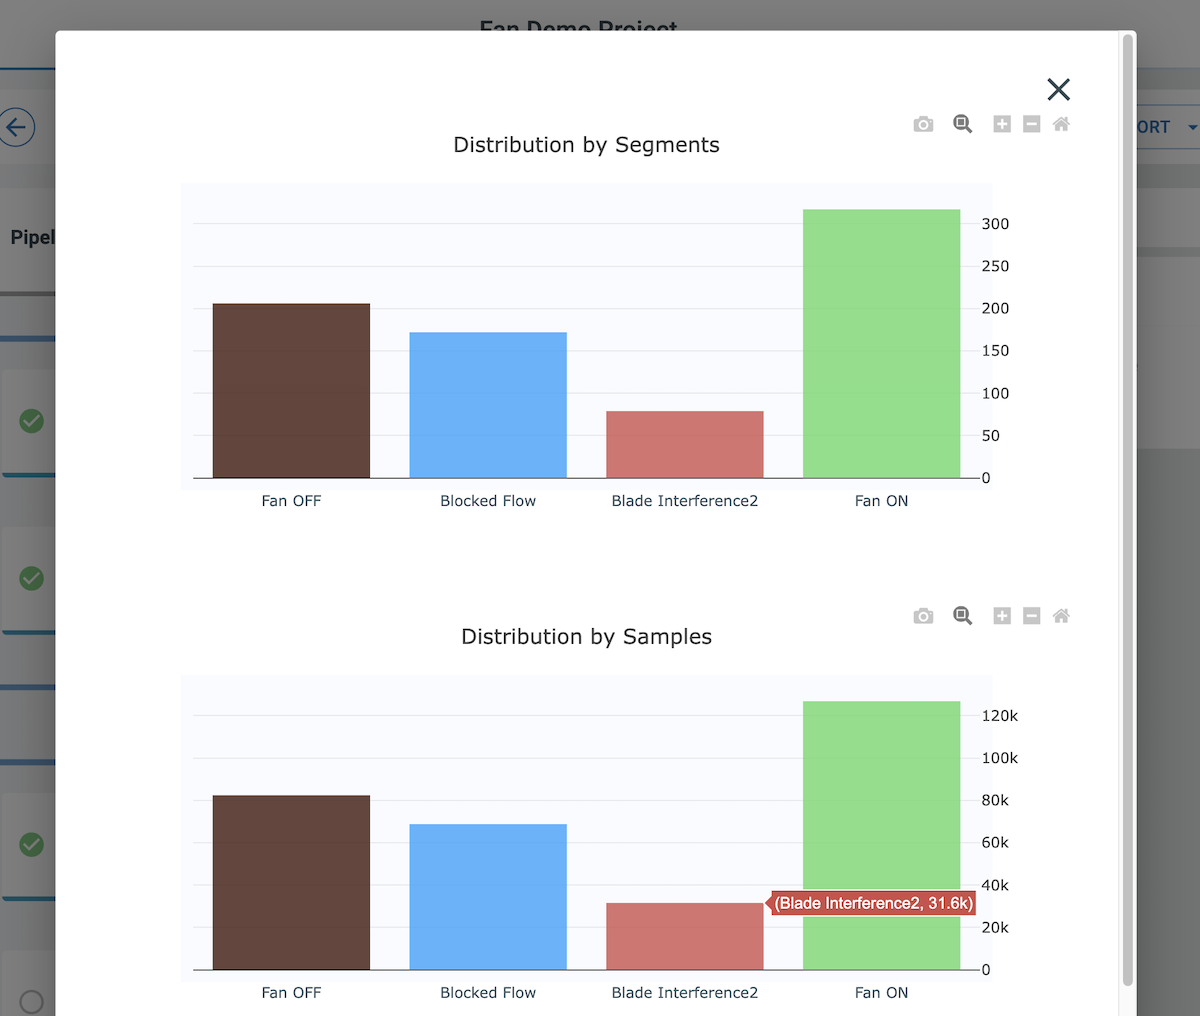
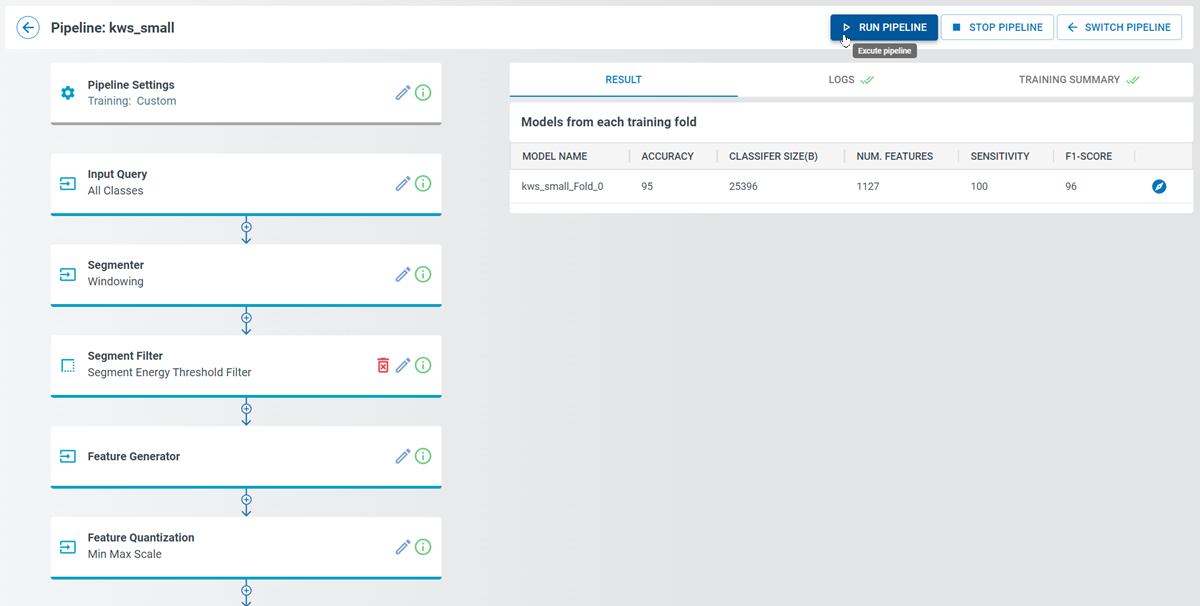
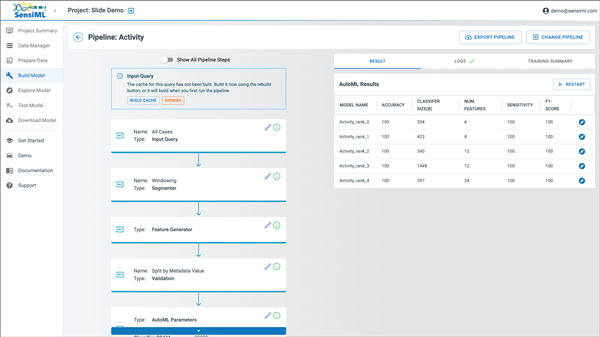
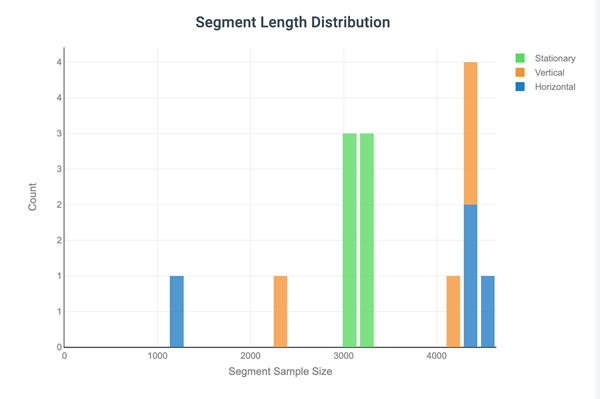
Added graph with distribution of step segments, samples, and feature vectors to the Pipeline Builder
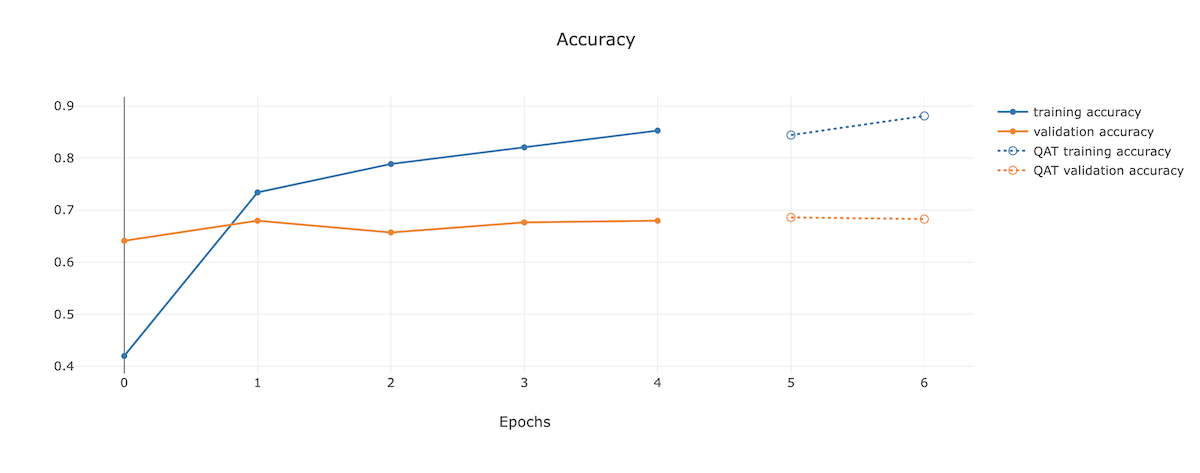
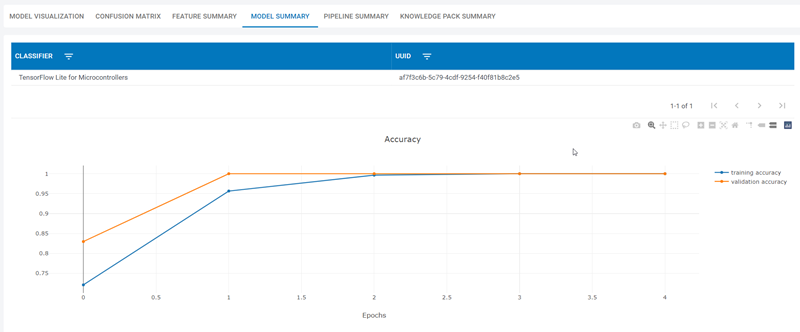
Updated the Model Summary graph to show Quantization Aware Training metrics
Bug Fixes
Fixed issue where the Pipeline Builder showed the Edit button for classifier and training algorithm steps when AutoML was enabled
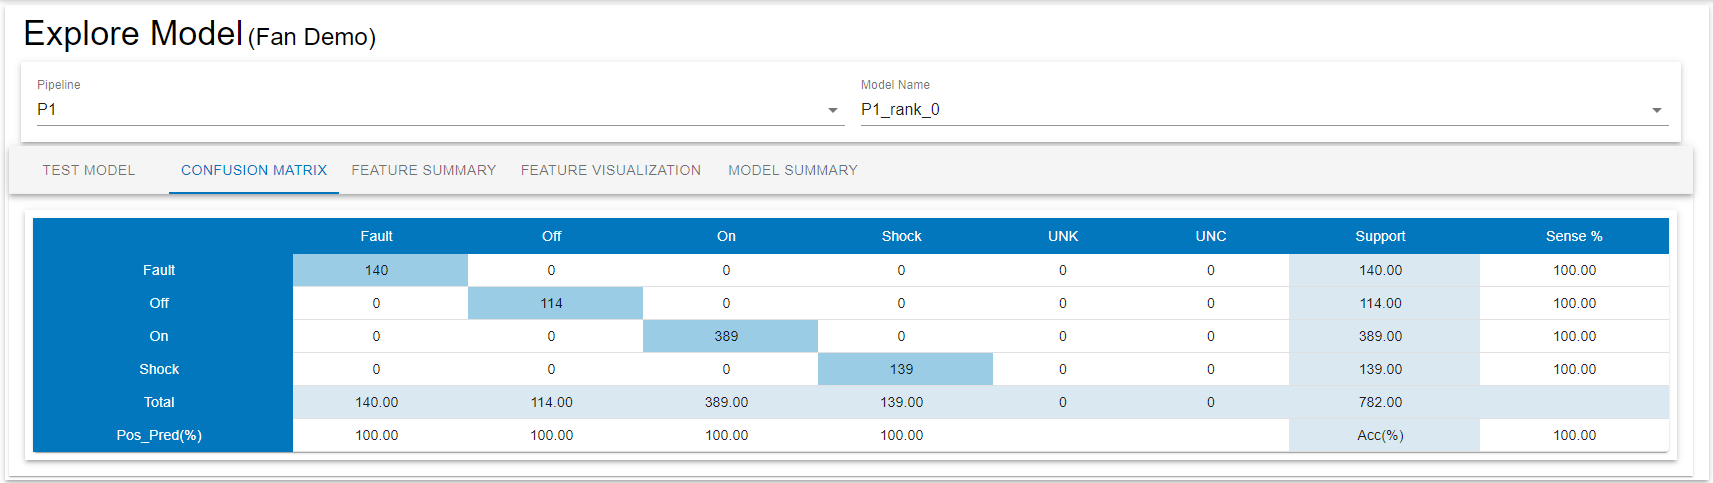
Fixed issue where the Confusion Matrix was sometimes not rounding all numbers to two digits
Fixed issue where the Classifier latency did not load in the Download Model screen for custom models
Past Releases
2023.8.0 (12/19/2023)
What’s New
Major Features
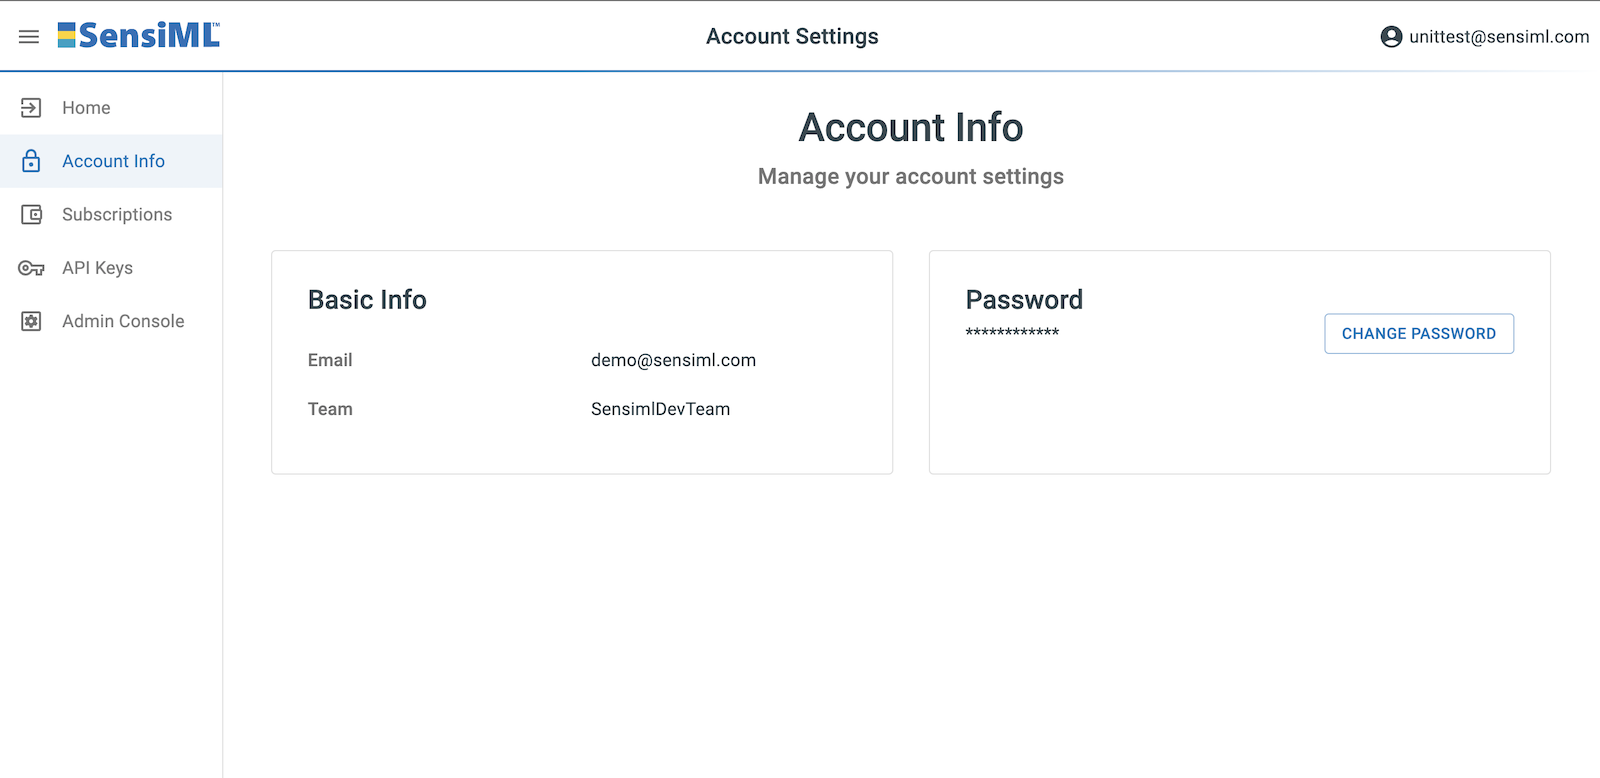
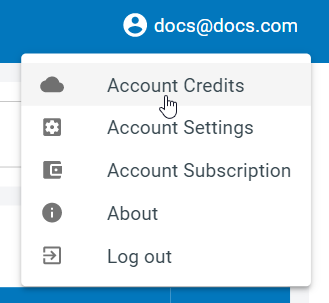
Added account settings page that allows managing account information, subscriptions, and API keys
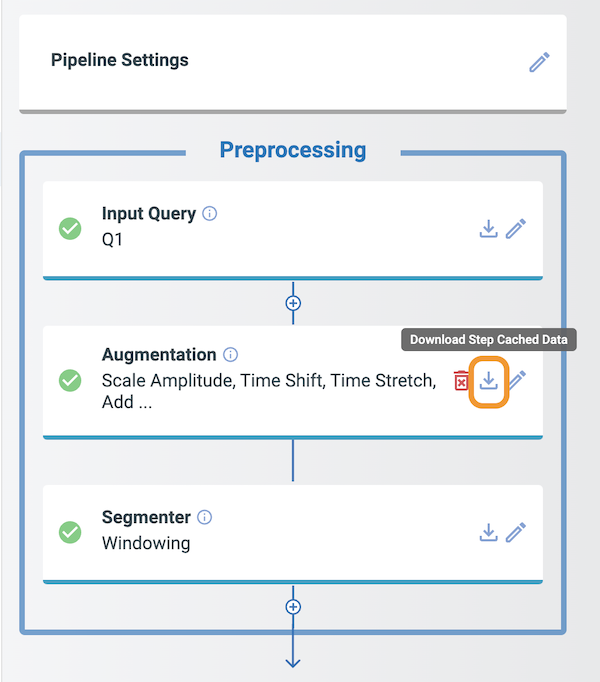
Added functionality to download pipeline cache from the Pipeline Builder
Bug Fixes
Fixed “Select All” checkbox in the Test Model screen
2023.7.0 (11/06/2023)
What’s New
Major Features
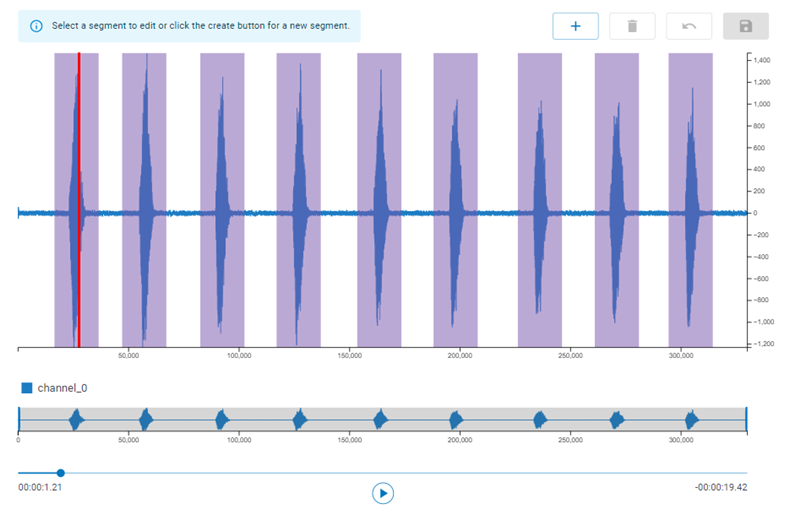
Added audio player to the Data Manager screen
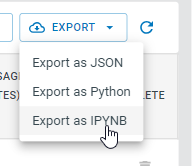
Added buttons to download pipelines in JSON, Python, and Python notebook format
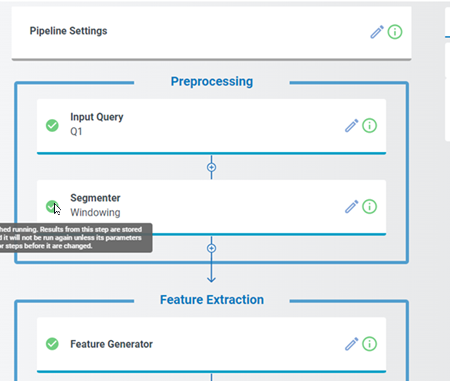
Organized pipeline builder steps according to data processing task
Added building and cache statuses to the Pipeline Builder screen
Minor Features
Added autoscrolling to the result on the Test Model screen
Made Processor field searchable at the Download Model screen
Bug Fixes
Fixed incorrect default compiler
Fixed issue where Magnitude transform used incorrect sensor columns
Fixed incorrect label colors on the Prepare Data charts
2023.6.0 (09/21/2023)
What’s New
Major Features
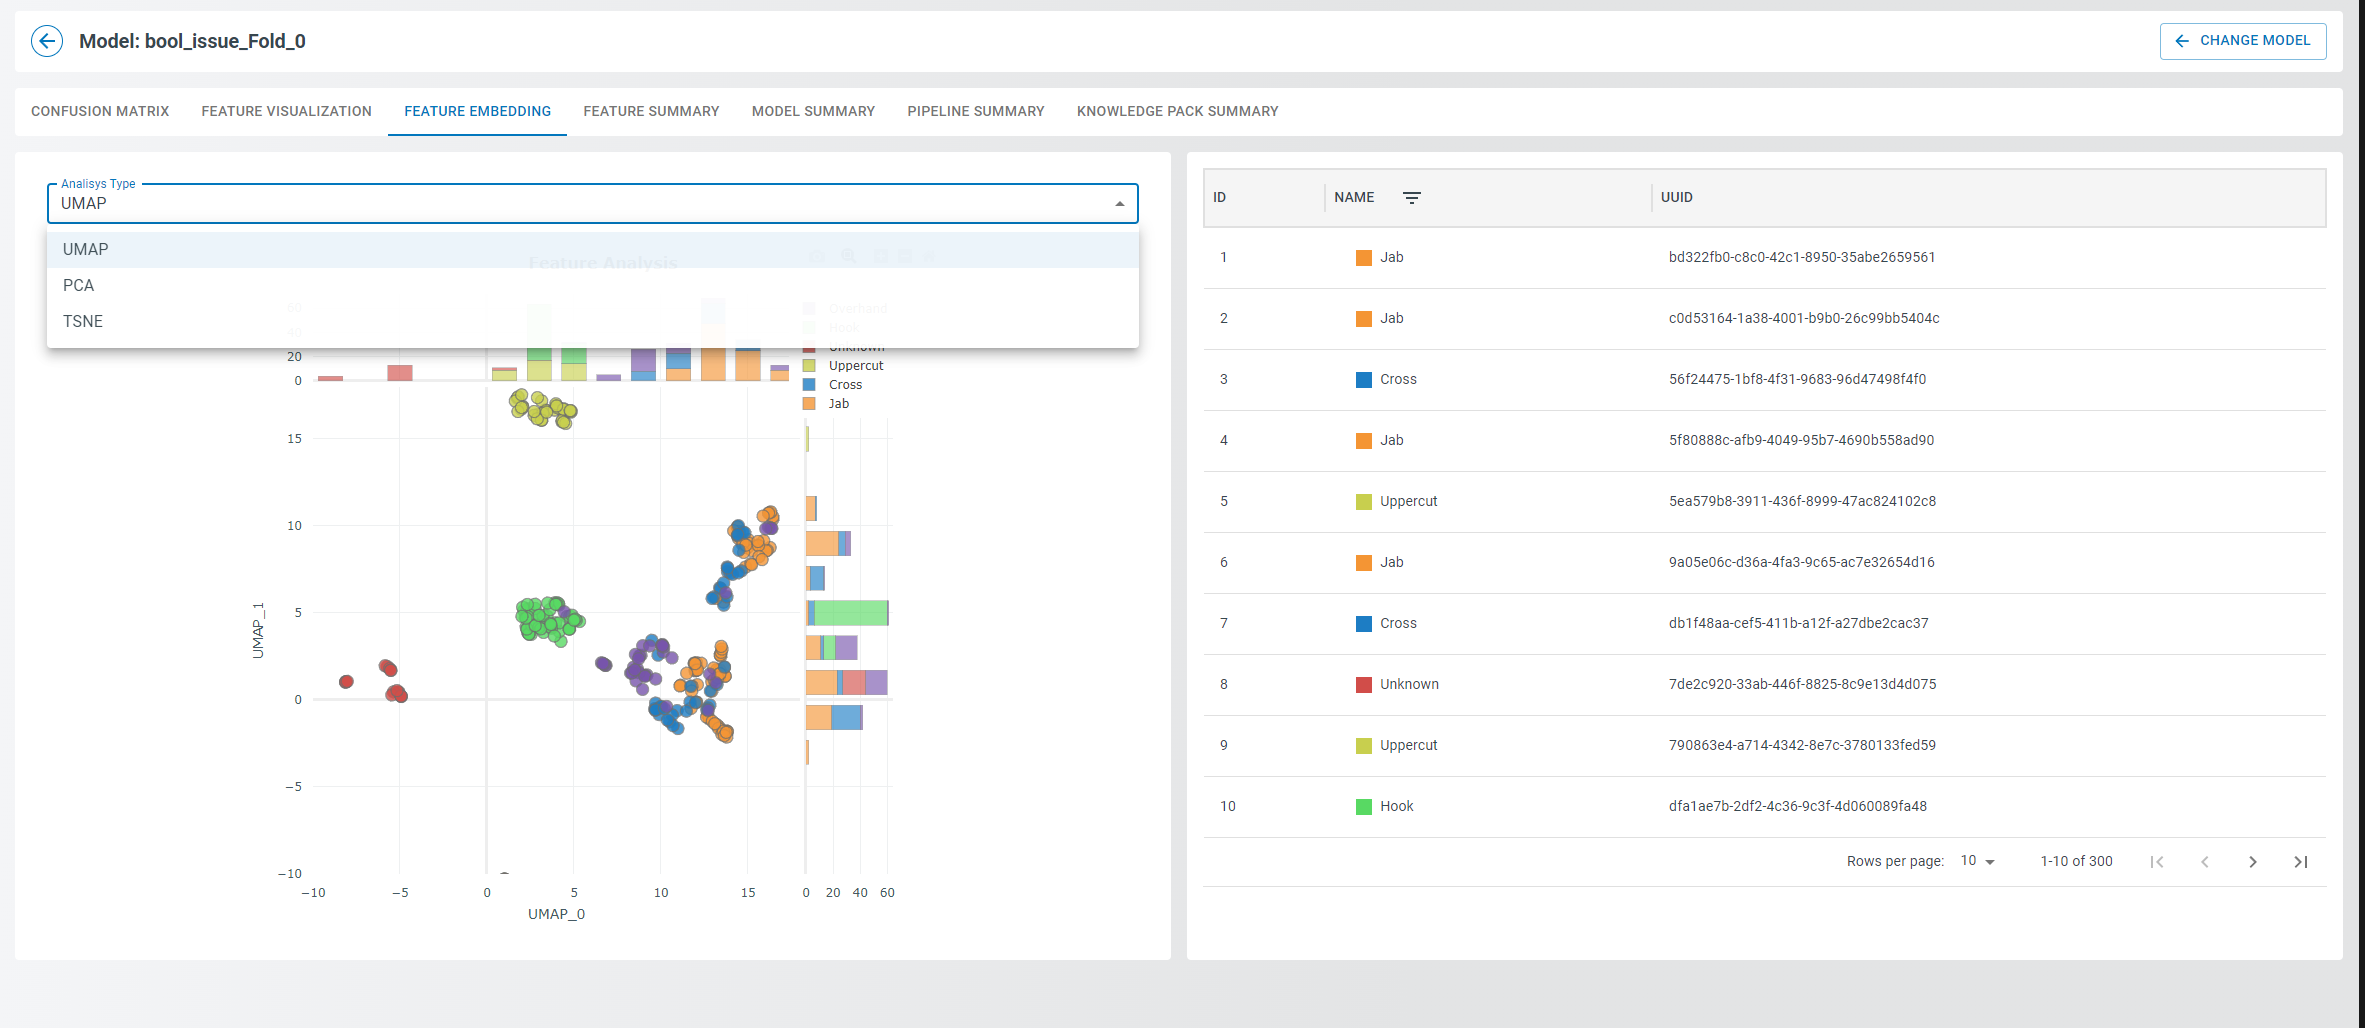
Added a Feature Embedding tab in the Model Explore page that enables data visualization for UMAP, PCA, and TSNE embedding methods
Updated Feature Vector to provide segments and feature insights chart
Improved the pipeline builder to make it easier to use
Improved performance for Explore Model tab
Improved responsiveness for small-screen form factor
Minor Features
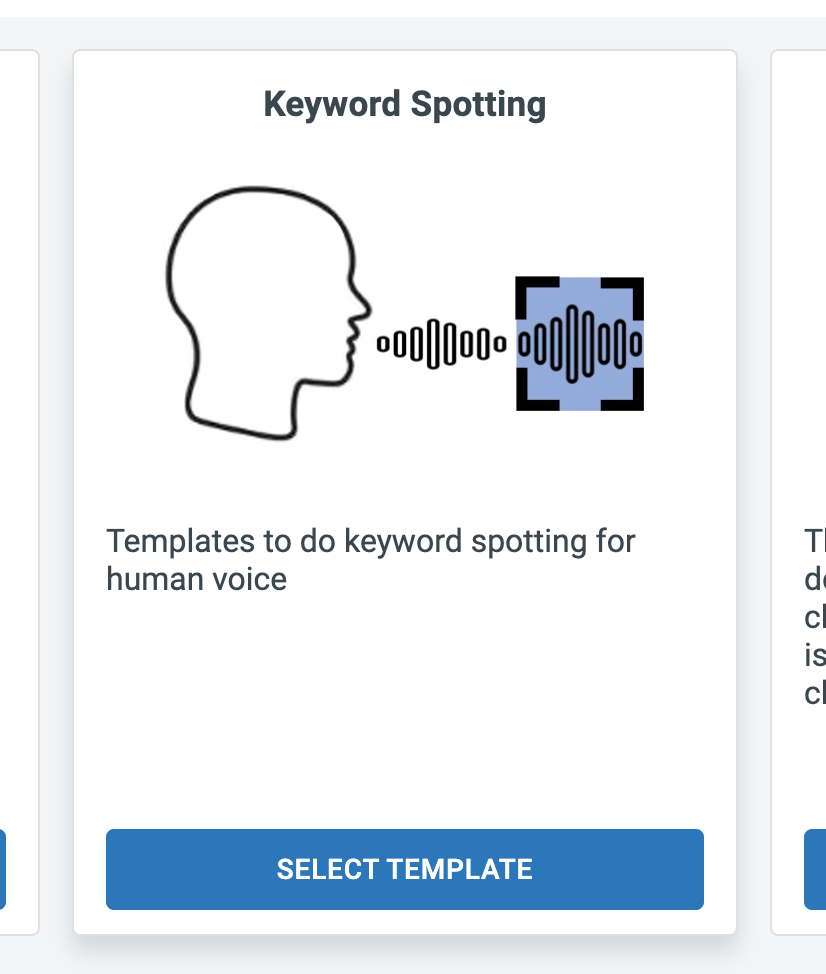
Improved Keyword Spotting template
Synced query filter with changing metadata field in query form
Improved validation warning for AutoML pipelines
Bug Fixes
Fixed bug where the “Created” date was wrong in the query table
Fixed bug where model information was not loading correctly after a pipeline was built
Fixed bug where invalid metadata could prevent editing of imported capture files
2023.5.1 (06/29/2023)
What’s New
Minor Features
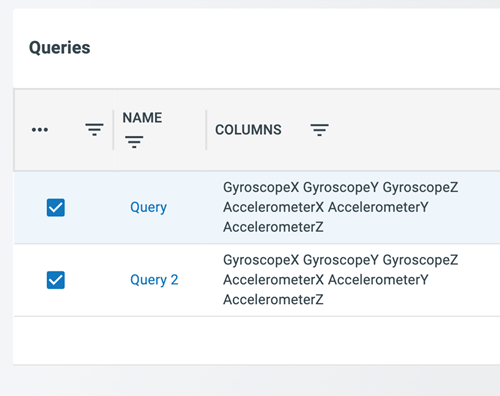
Added item selection functionality to Pipelines, Queries, and Models tables
Bug Fixes
Fixed bug where the capture table did not update after uploading files
Fixed bug with item selection in the Test Model screen table
Fixed bug where the projects table search bar did not work properly with paginated pages
Fixed bug where direct URL links did not work after logging in
2023.5.0 (06/14/2023)
What’s New
Major Features
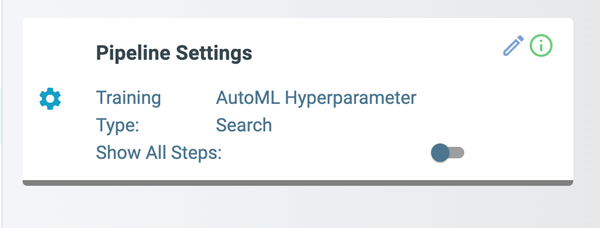
Updated Pipeline Settings in Pipeline Builder
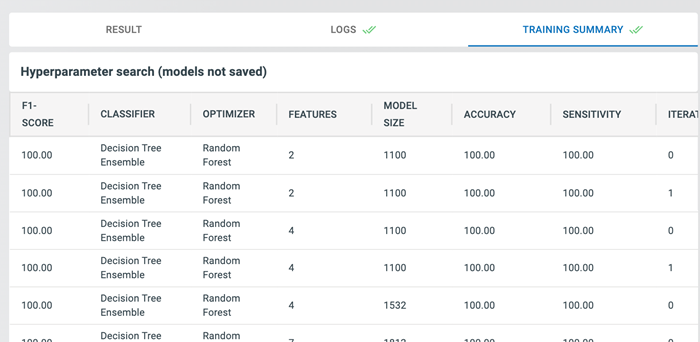
Added new Training Summary with all AutoML models generated during the training process
Improved performance of loading the Data Manager Capture Files table
Minor Features
Added a session filter to Data Manager Capture Files table

Added Pipeline actions buttons to the top panel

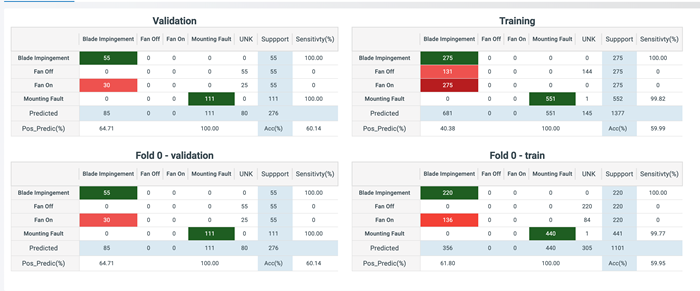
Improved Confusion Matrix
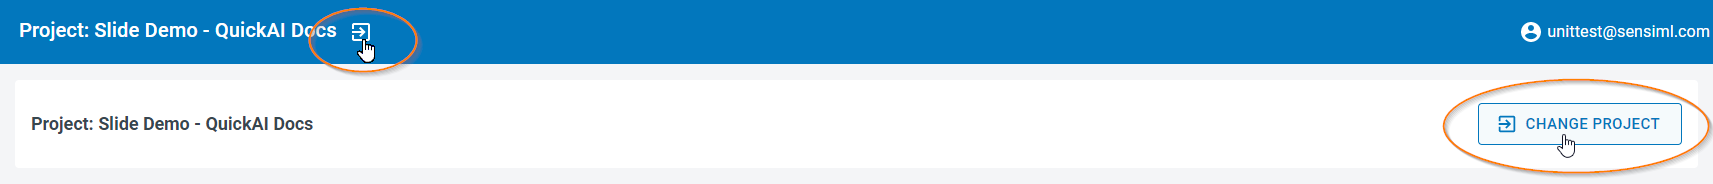
Improved workflow of changing projects
Removed Hierarchical Model option from AutoML settings
Bug Fixes
Fixed bug that caused Feature Visualization to not load properly after changing the active model
Fixed bug where min_max_scale was getting overwritten in the JSON tab
Fixed bug that could break the Data Manager chart width while rendering
Fixed bug with query screen label colors
2023.4.0 (05/08/2023)
What’s New
Major Features
Upgraded UI and restyled various components
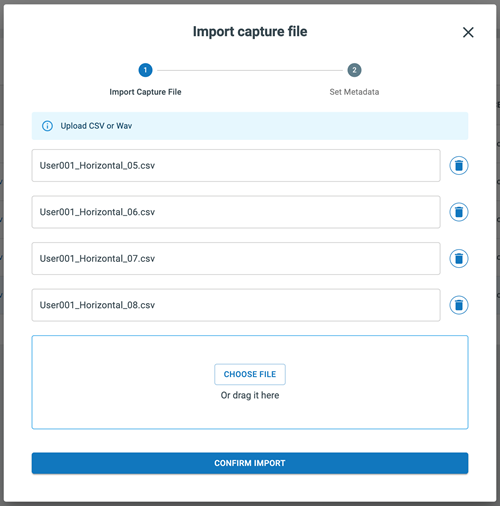
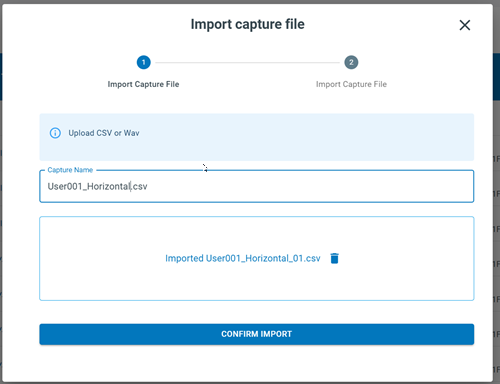
Added a new form for importing capture files with the ability to upload multiple files
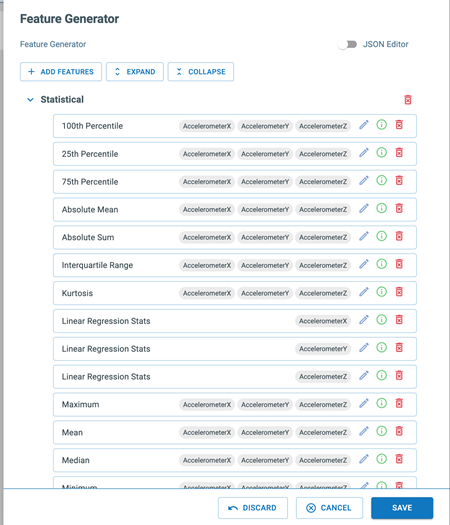
Improved Feature Generator form for better usability
Minor Features
Improved Keyword Spotting template
Test Model’s action buttons moved to the top
Updated Confusion Matrix charts
Bug Fixes
Fixed bugs where routers changing not loading at the top of the page
2023.3.0 (03/22/2023)
What’s New
Major Features
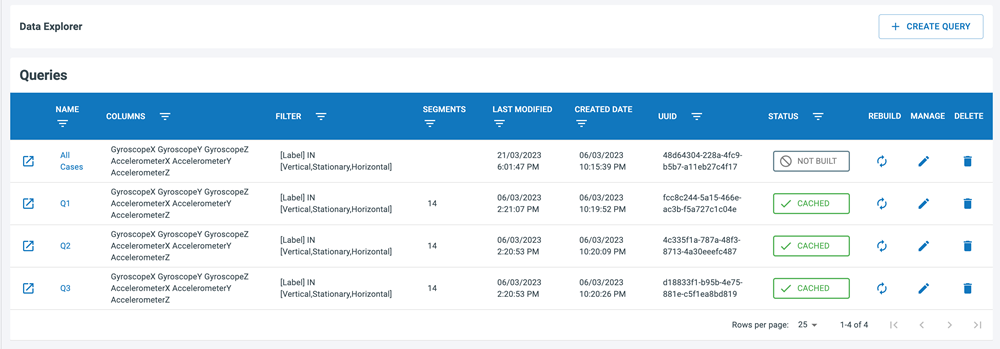
Added Data Explorer screen and Queries table with features to create, edit, delete, and build caches for queries
Minor Features
Updated Query Screen charts
Updated Select Target screen in the Download Model tab
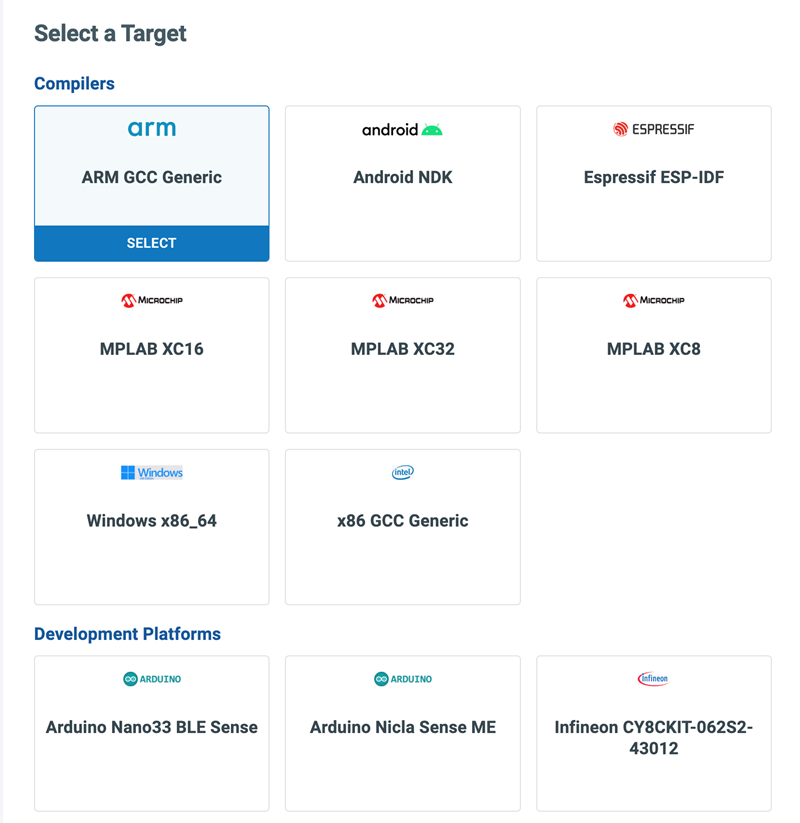
Added a Change Platform button to the control panel in the Download Model tab

Bug Fixes
Fixed issue where the Confusion Matrix is not loading properly
Fixed issue in Pipeline Templates where sensor fields are not being set correctly
2023.2.0 (03/07/2023)
What’s New
Major Features
Added new tab called the Data Manager with features to upload, delete, download files, and manage file metadata
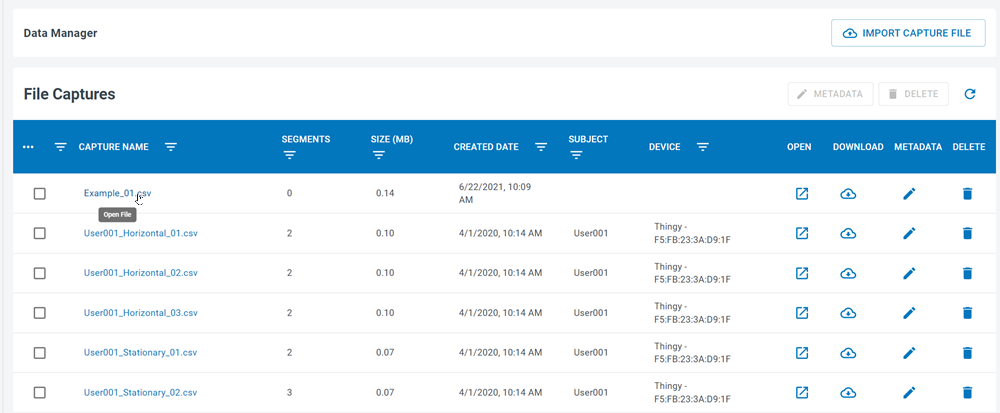
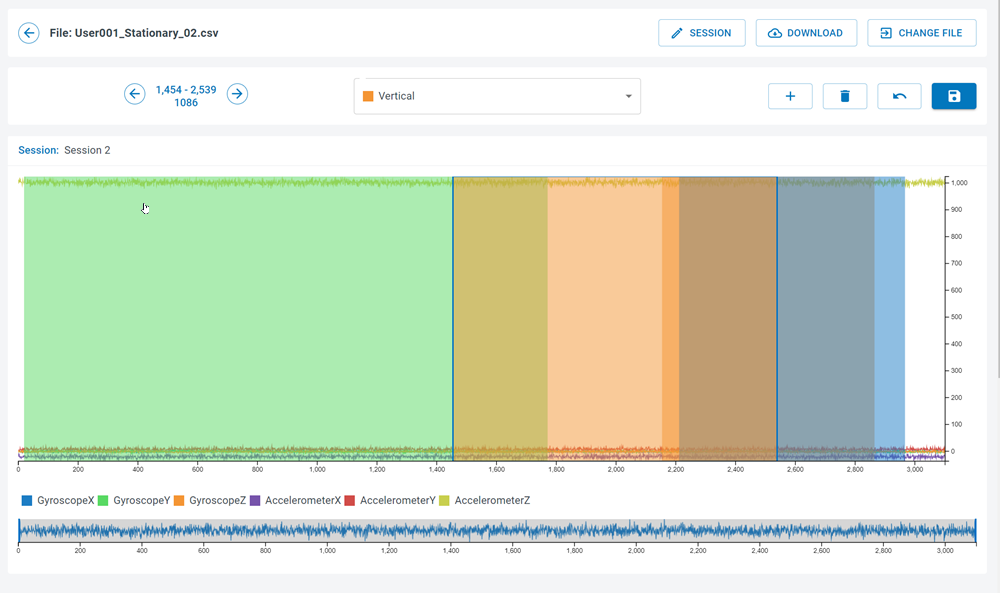
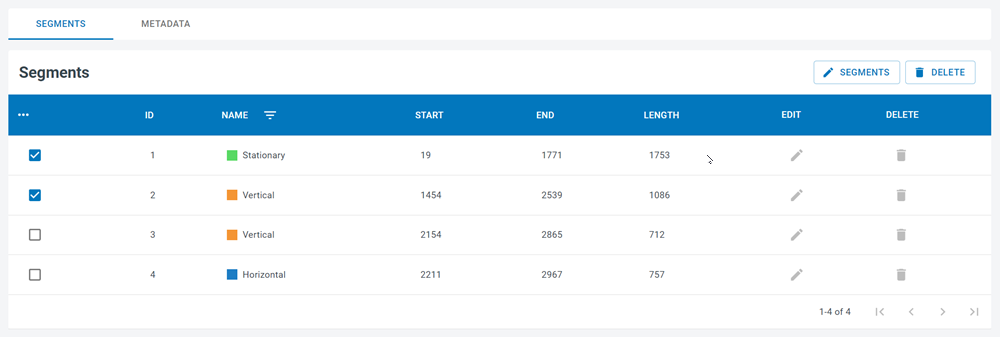
Added feature to open capture files in the Data Manager with options to add, update, and delete segments in the files
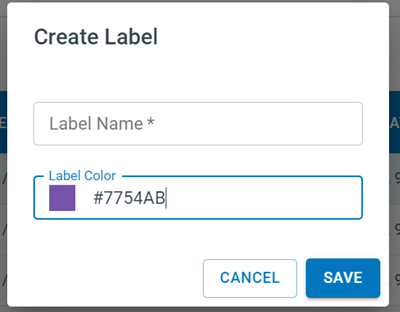
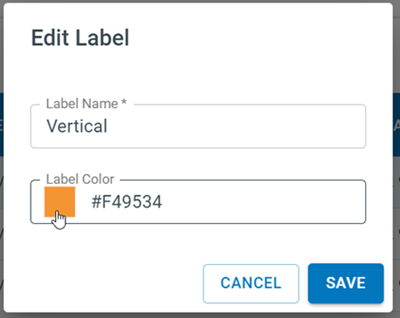
Added Labels screen to the Project Settings with options to create, edit, and delete labels in a project
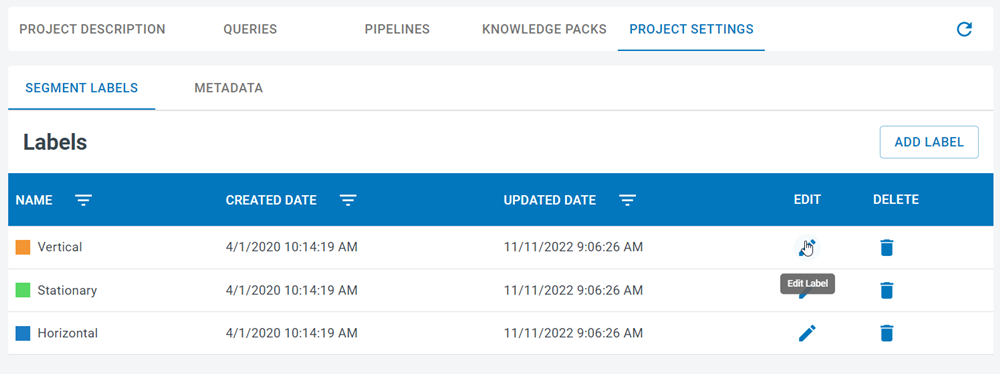
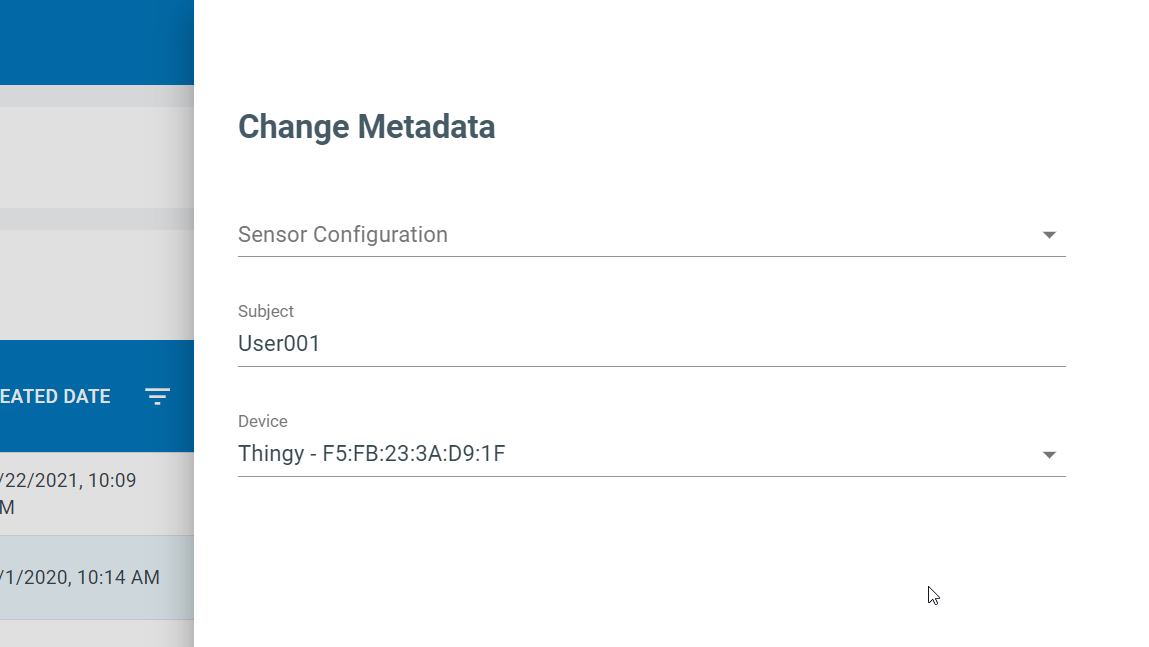
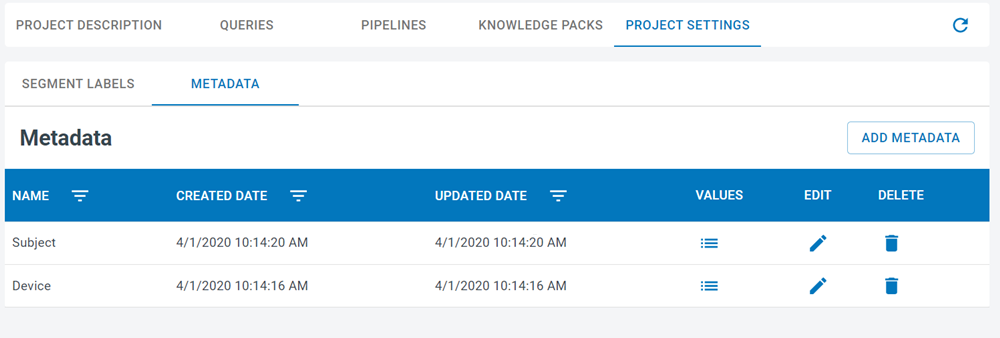
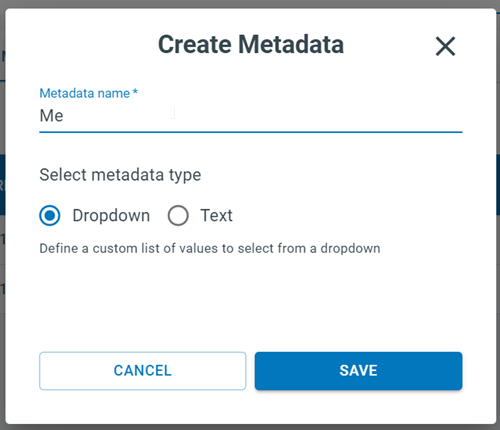
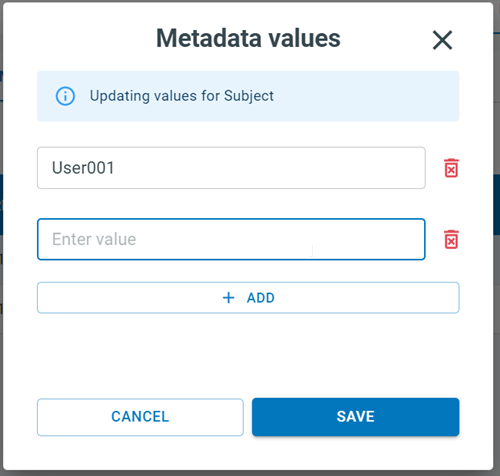
Added Metadata screen to the Project Settings with options to create, edit, and delete metadata in a project
Added Vibration Classification, Activity Recognition, and Gesture Recognition templates to the Pipeline Builder
Minor Features
Added option to create a new Project
Improved performance of Model Explorer screen
Bug Fixes
Fixed a bug with rendering parameters correctly in the pipeline builder
Fixed a bug with showing server error messages
2023.1.0 (02/02/2023)
Major Features
What’s New
Added Keyword Spotting template to the Pipeline Builder
2022.4.2 (12/01/2022)
Minor Features
What’s New
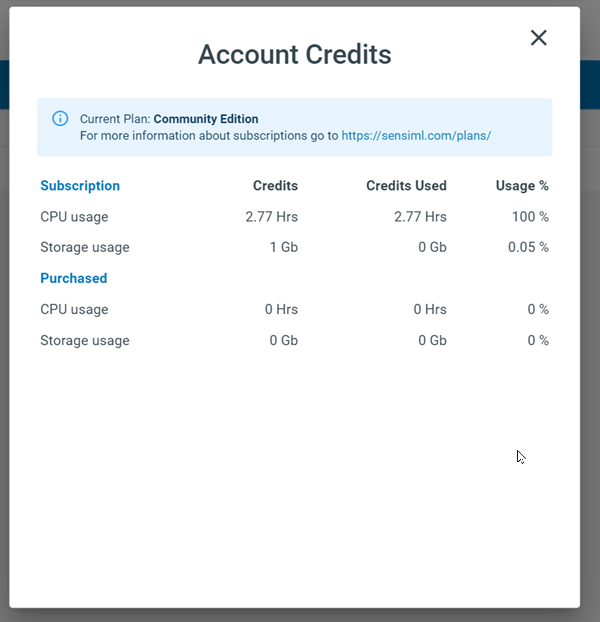
Added a window about the usage of Account Credits
Improved Explore Model view
Improved query caching
2022.4.1 (08/11/2022)
Minor Features
What’s New
Added better support for low resolution monitors
Updated the alert about unsaved pipeline changes
Bug Fixes
Fixed a bug with updating values for the input slider in the pipeline builder forms
2022.4.0 (07/26/2022)
What’s New
Major Features
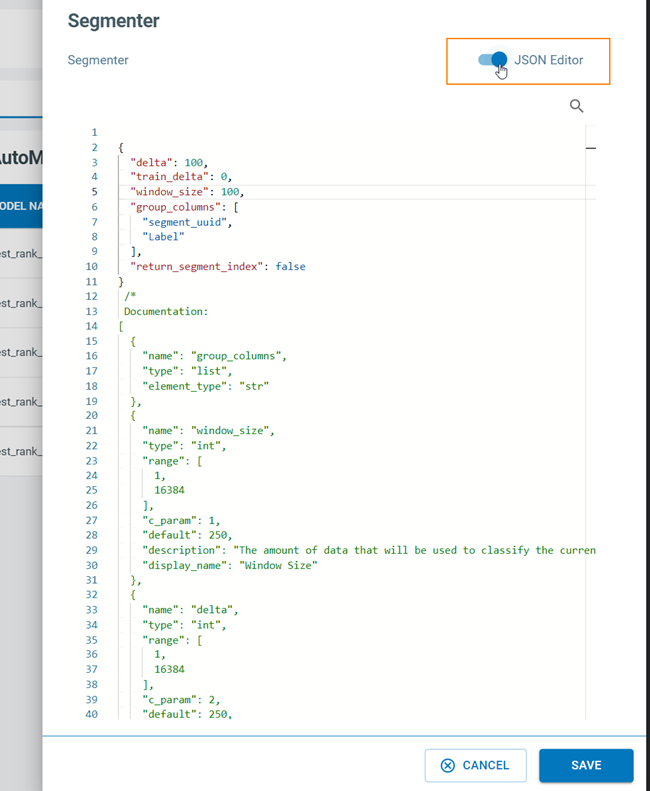
Added JSON editor to the pipeline builder
Minor Features
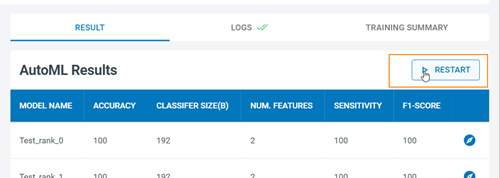
Added a restart button to the result table in the pipeline builder screen
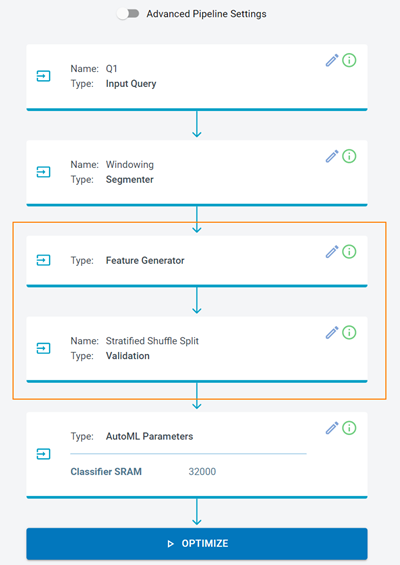
Added Feature Generator and Validation steps to AutoML pipeline and Classifier
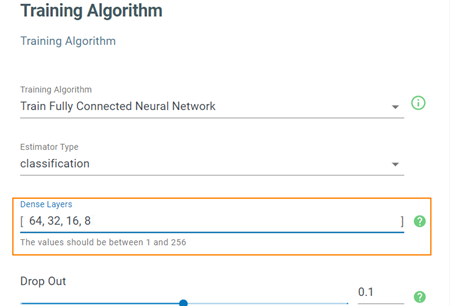
Added Training Algorithm steps to the custom training pipeline in the pipeline builder
AutoML pipeline
Custom training pipeline
Bug Fixes
Fixed a bug with saving data at the array from field
Fixed classifier selection for creating a custom training pipeline
Fixed formatting pipeline data for pipeline builder screen
2022.3.1 (05/26/2022)
What’s New
Minor Features
Improved validation in the pipeline builder
2022.3.0 (05/19/2022)
What’s New
Major Features
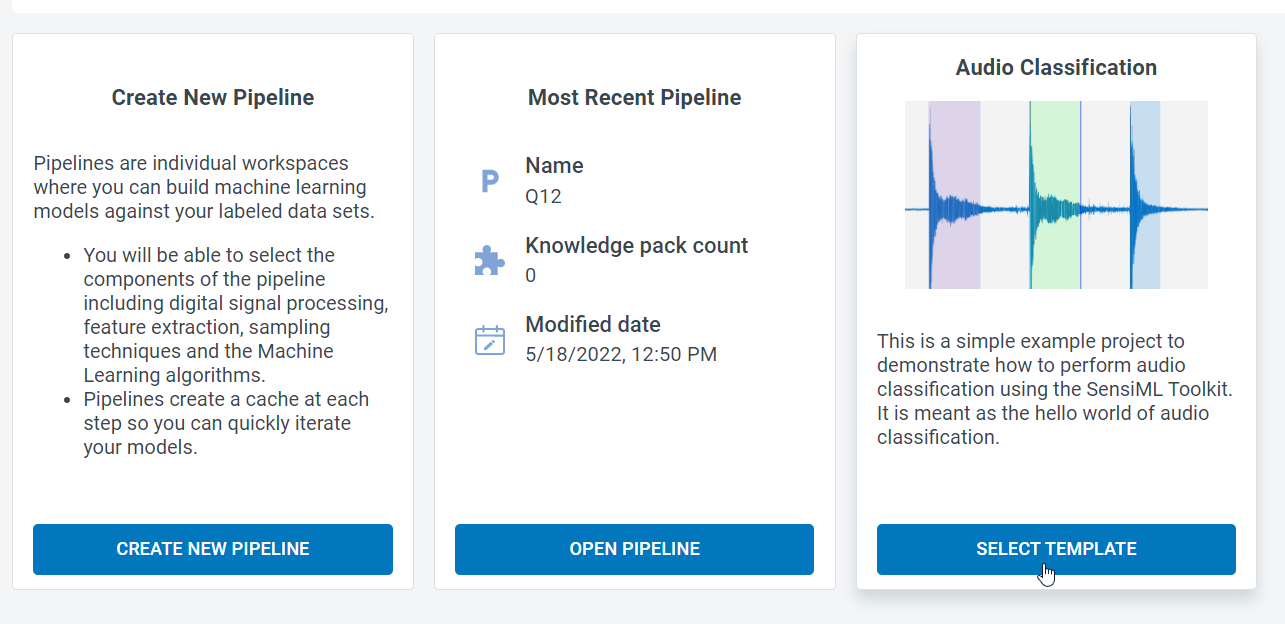
Added audio classification pipeline template to the pipeline builder
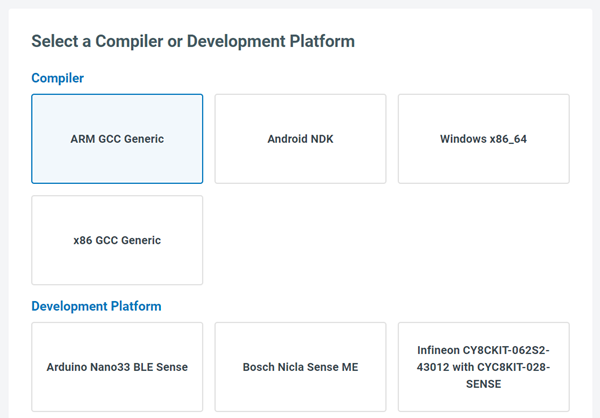
Added new selection for compilers and development platforms in the download model screen
Minor Features
Improved Profile Information loading in the download model screen
Improved logic for handling trying to open, delete, rename deleted models
Improved logic for loading model data
Bug Fixes
Fixed showing unnecessary warning alert in the pipeline builder screen
Fixed bugs where filtering labels were not matching with a query in the pipeline builder screen
Fixed classification chart bug with scaling in the explore model screen
Added sanitizing model names before sending to download
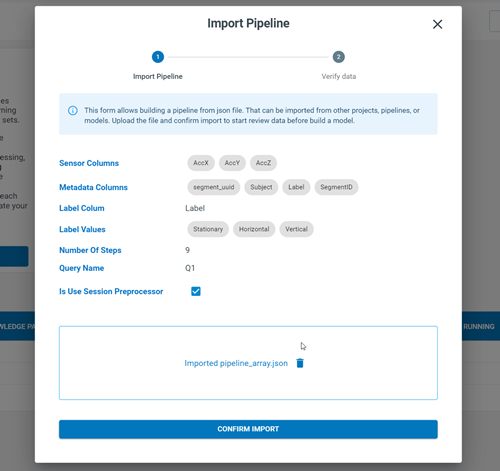
Fixed bug with parsing use_session_preprocessor param during import pipelines and pipeline templates
2022.2.0 (04/26/2022)
What’s New
Major Features
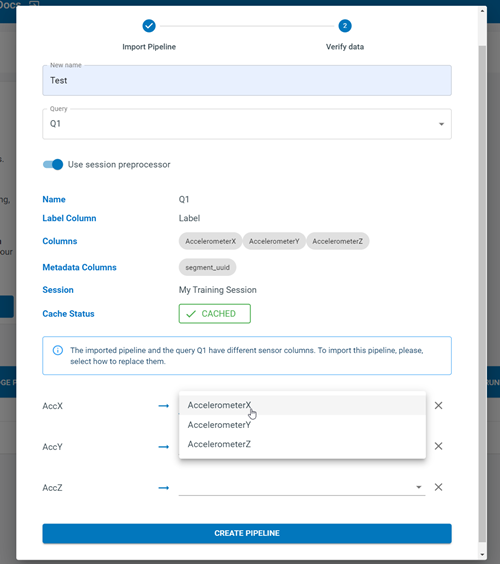
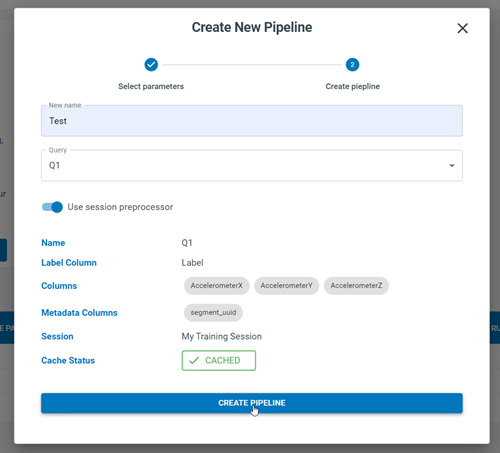
Added importing pipeline to the pipeline builder
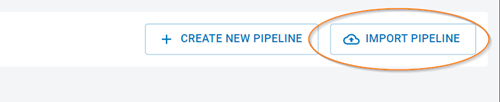
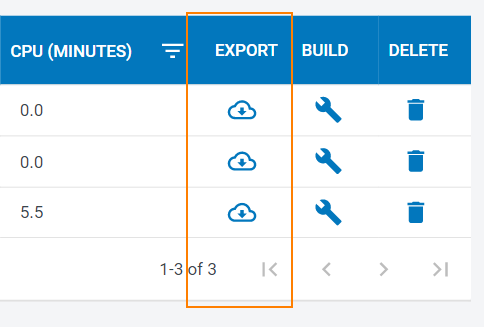
Added exporting pipeline to the pipeline builder

Added query selection to form for creating a new pipeline
Minor Features
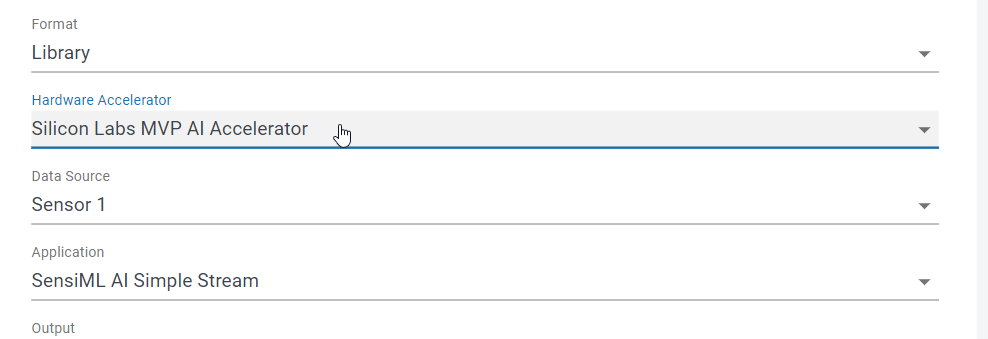
Added HW Accelerator option to the download screen
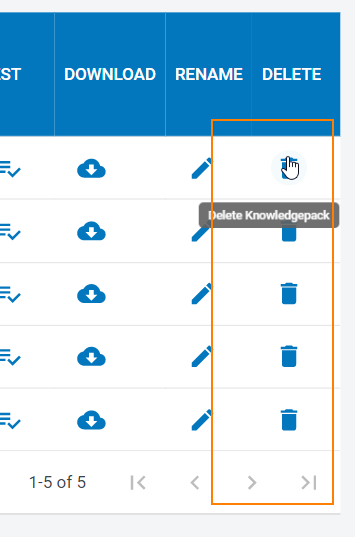
Added option to delete Knowledge Packs
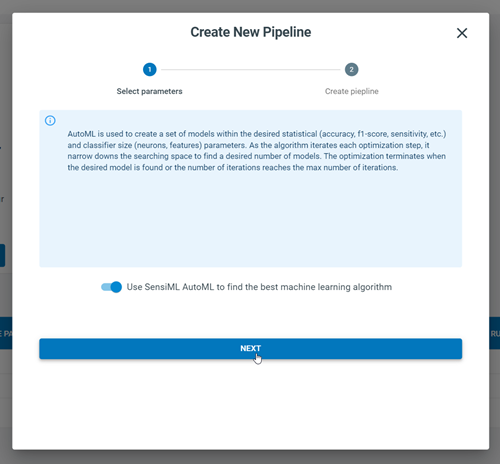
Added an information alert to the pipeline builder
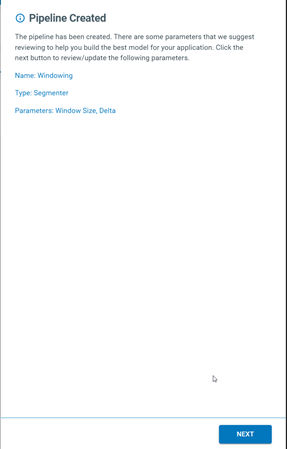
Added Loader with logs for creating and loading pipeline
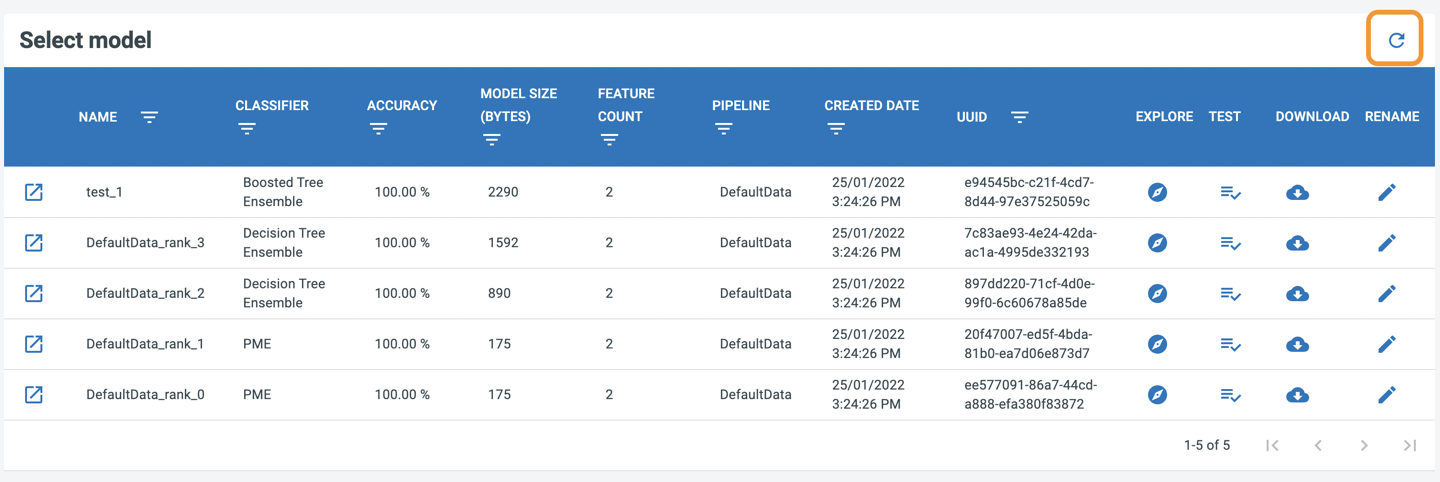
Added reload button to the captures table
Bug Fixes
Fixed filters at the captures table
Fixed incorrect sequence for loading pipelines
2022.1.1 (02/15/2022)
What’s New
Minor Features
Added reload button to Knowledge Pack table
Added saving AutoML pipeline parameters
Bug Fixes
Fixed saving parameters at Feature Selector step
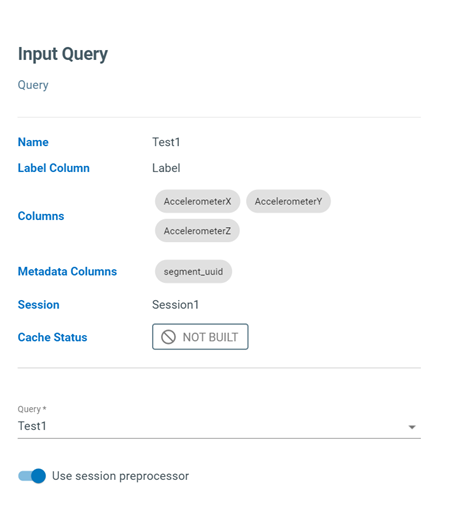
Fixed saving “Use Session Preprocessor” parameter at Input Query step
2022.1.0 (01/30/2022)
What’s New
Major Features
Added dictionary fields to the pipeline builder that covered parameters with dictionary types
Added editable array field to the pipeline builder that allows adding custom values to parameters
Added additional information to the model summary for PME and TensorFlow Lite for Microcontrollers classifiers
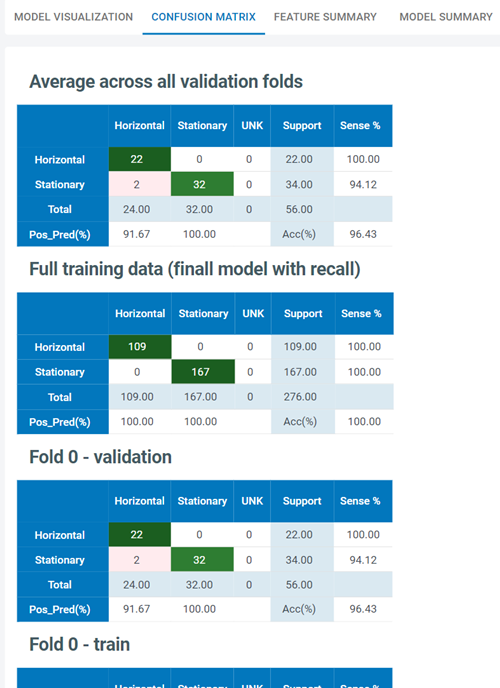
Added confusion matrix charts
Minor Features
Added information about CPU time usage to pipeline table
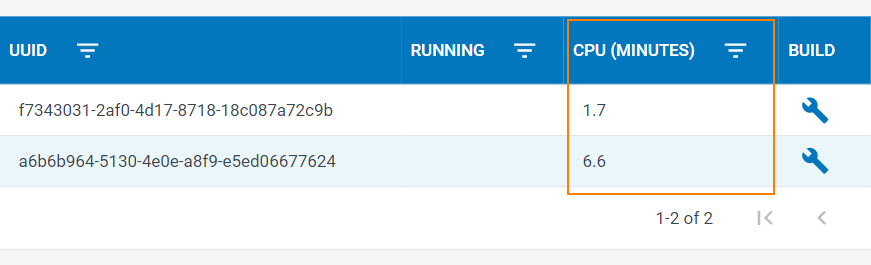
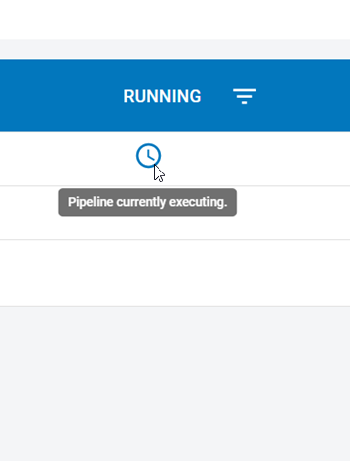
Added status of running to pipeline table
Added default TVO steps to pipelines that don’t have them
Bug Fixes
Fixed bug when changing classifier resets training algorithm step
Fixed order of feature selectors
Fixed indexing bug for adding and deleting pipeline steps
Fixed bug with editing feature generators with the same name
2021.5.0 (12/29/2021)
What’s New
Major Features
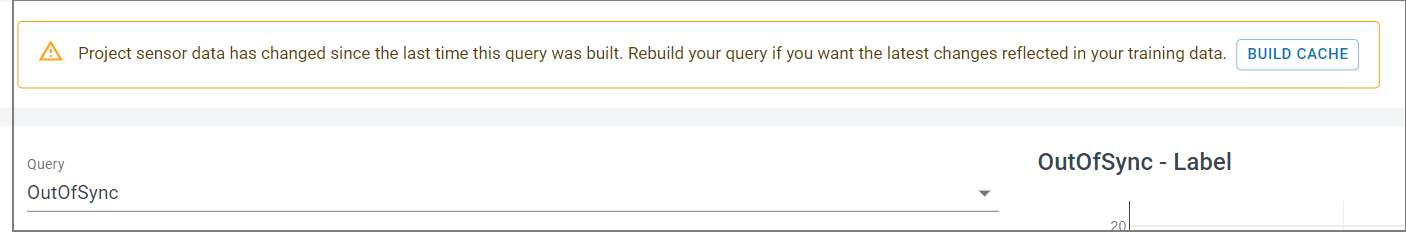
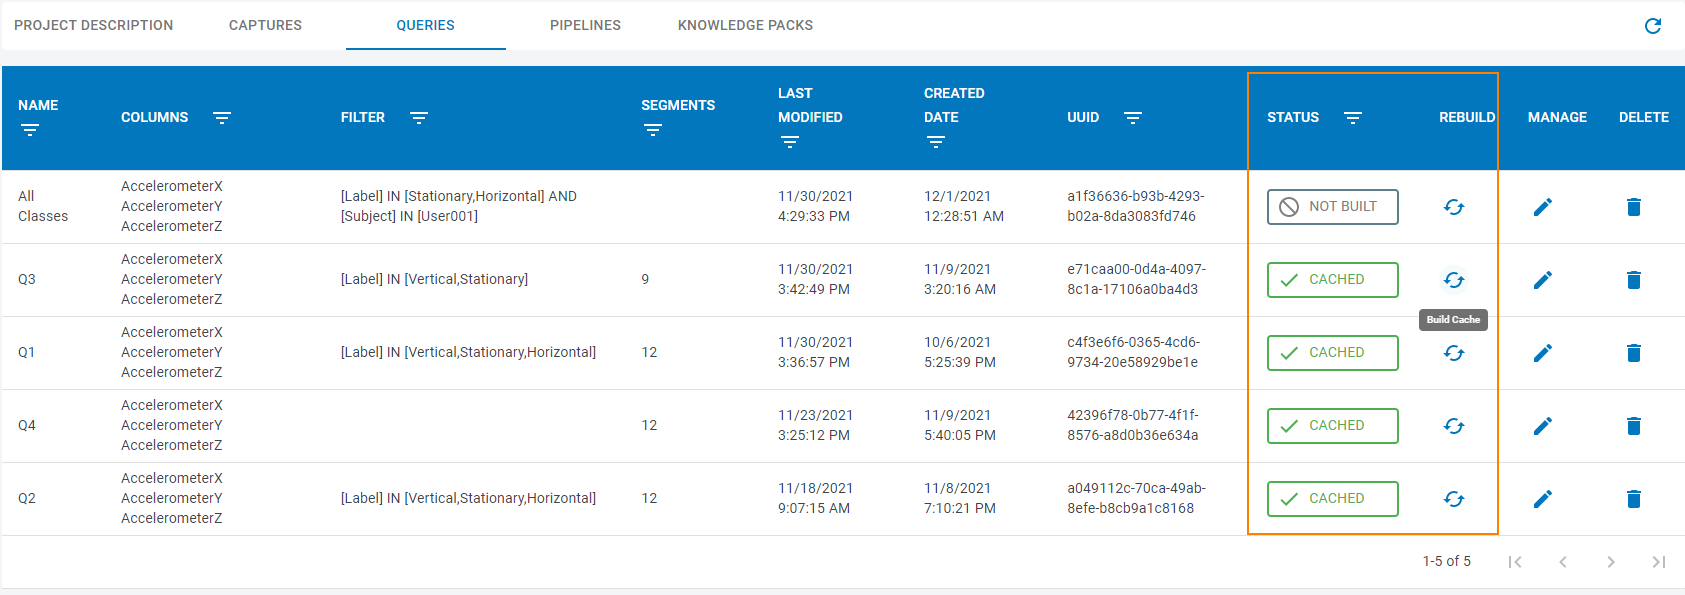
Added alerts about relevance and status of a query cache to the pipeline builder and query screen
Minor Features
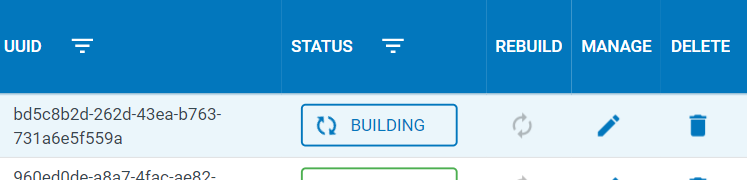
Added auto-updating status while building a new cache at the queries table
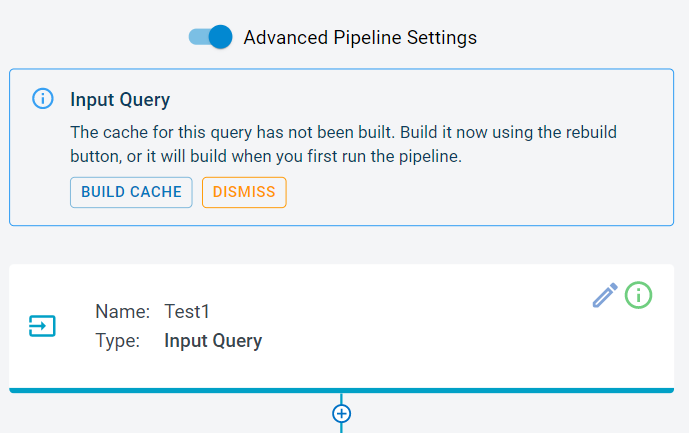
Added status of query cache to Input Query step at the pipeline builder screen
Improved the code quality coverage
Bug Fixes
Fixed default Training Algorithm selection for TensorFlow Micro Classifier at the pipeline builder
2021.4.1 (12/08/2021)
What’s New
Minor Features
Optimized logic for the pipeline builder query step updating
Bug Fixes
Fixed issue in the pipeline builder where default pipeline has incorrect passthrough_columns
2021.4.0 (12/02/2021)
What’s New
Major Features
Added a project navigation panel and button to switch an active project
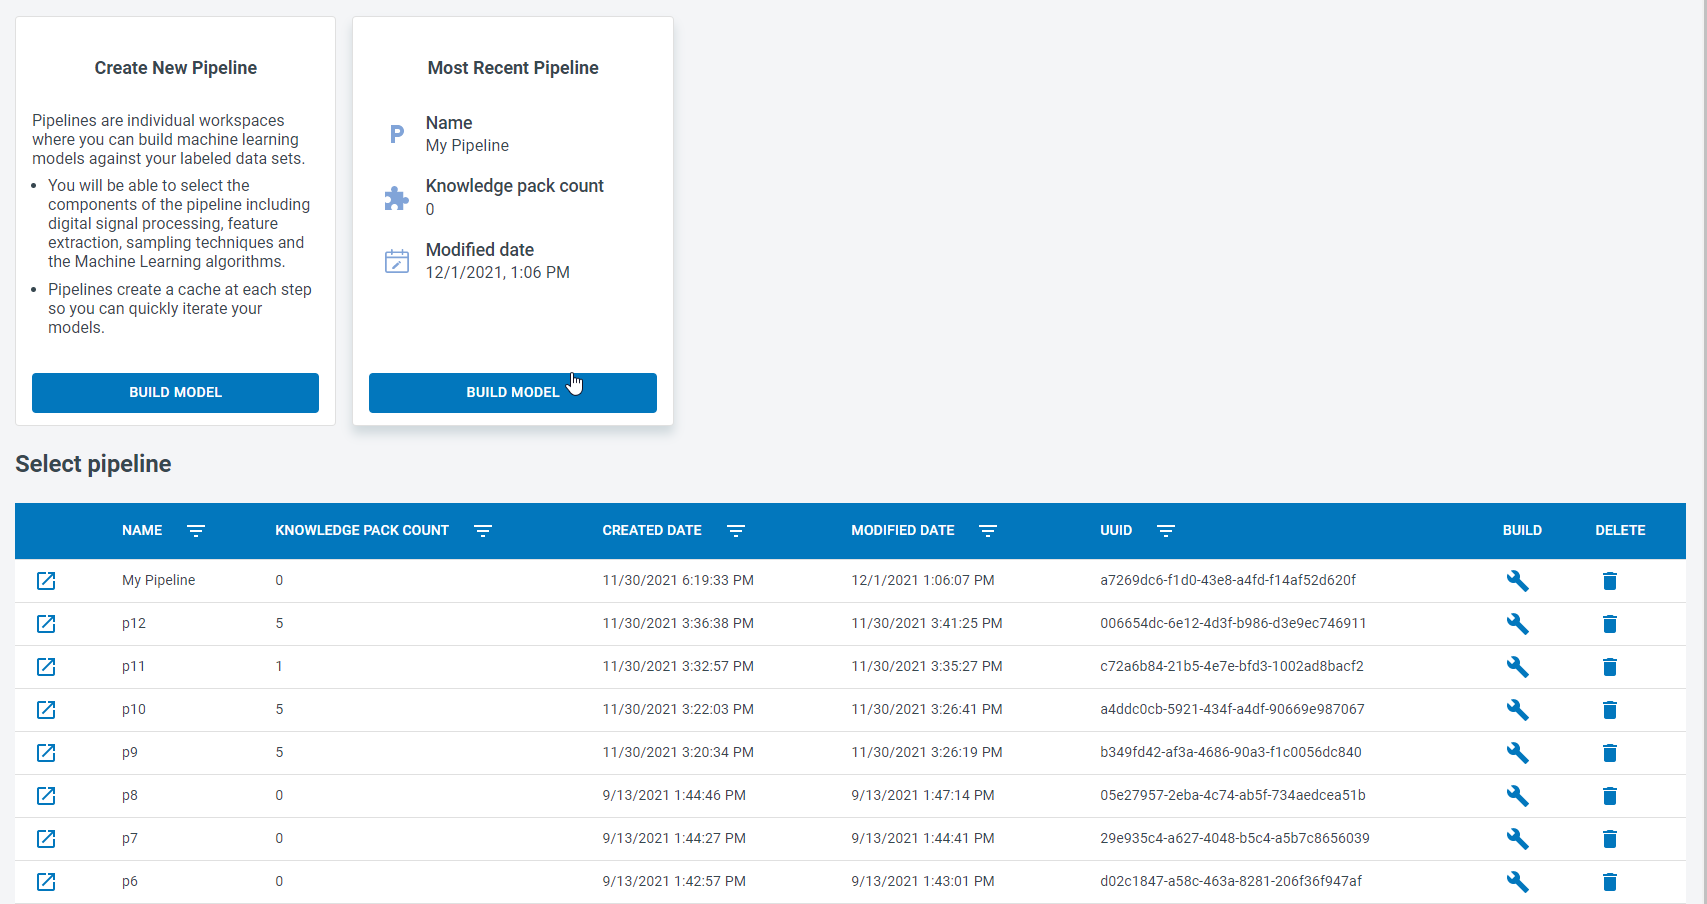
Added a new pipeline selection screen and pipeline navigation panel

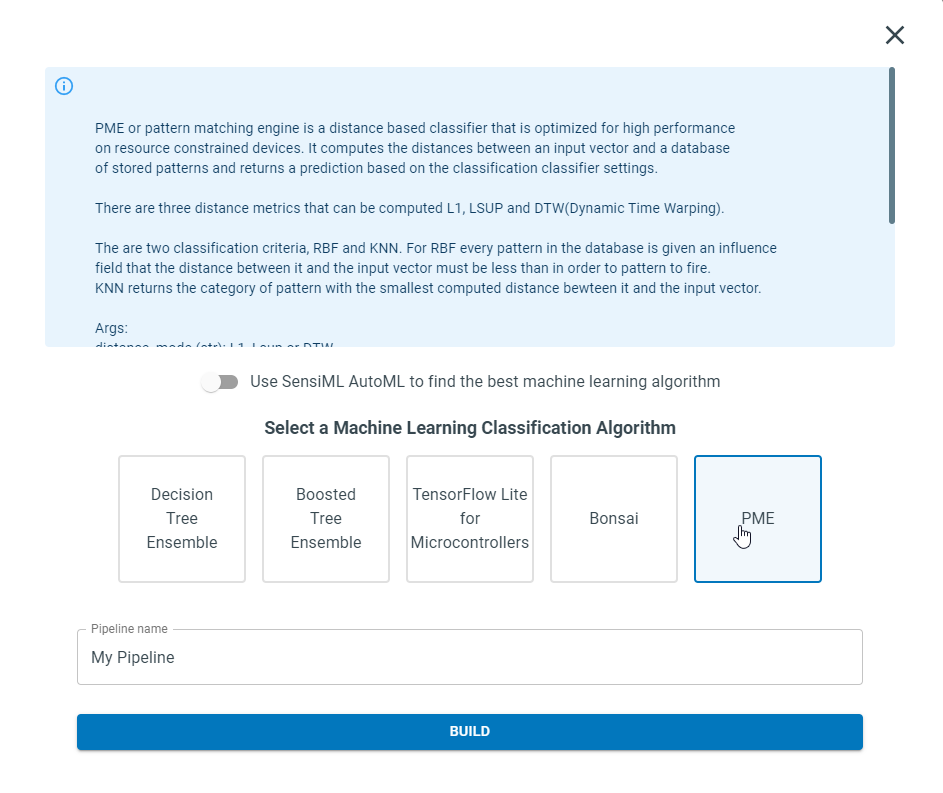
Added a new pipeline creation form with options to select machine learning algorithms
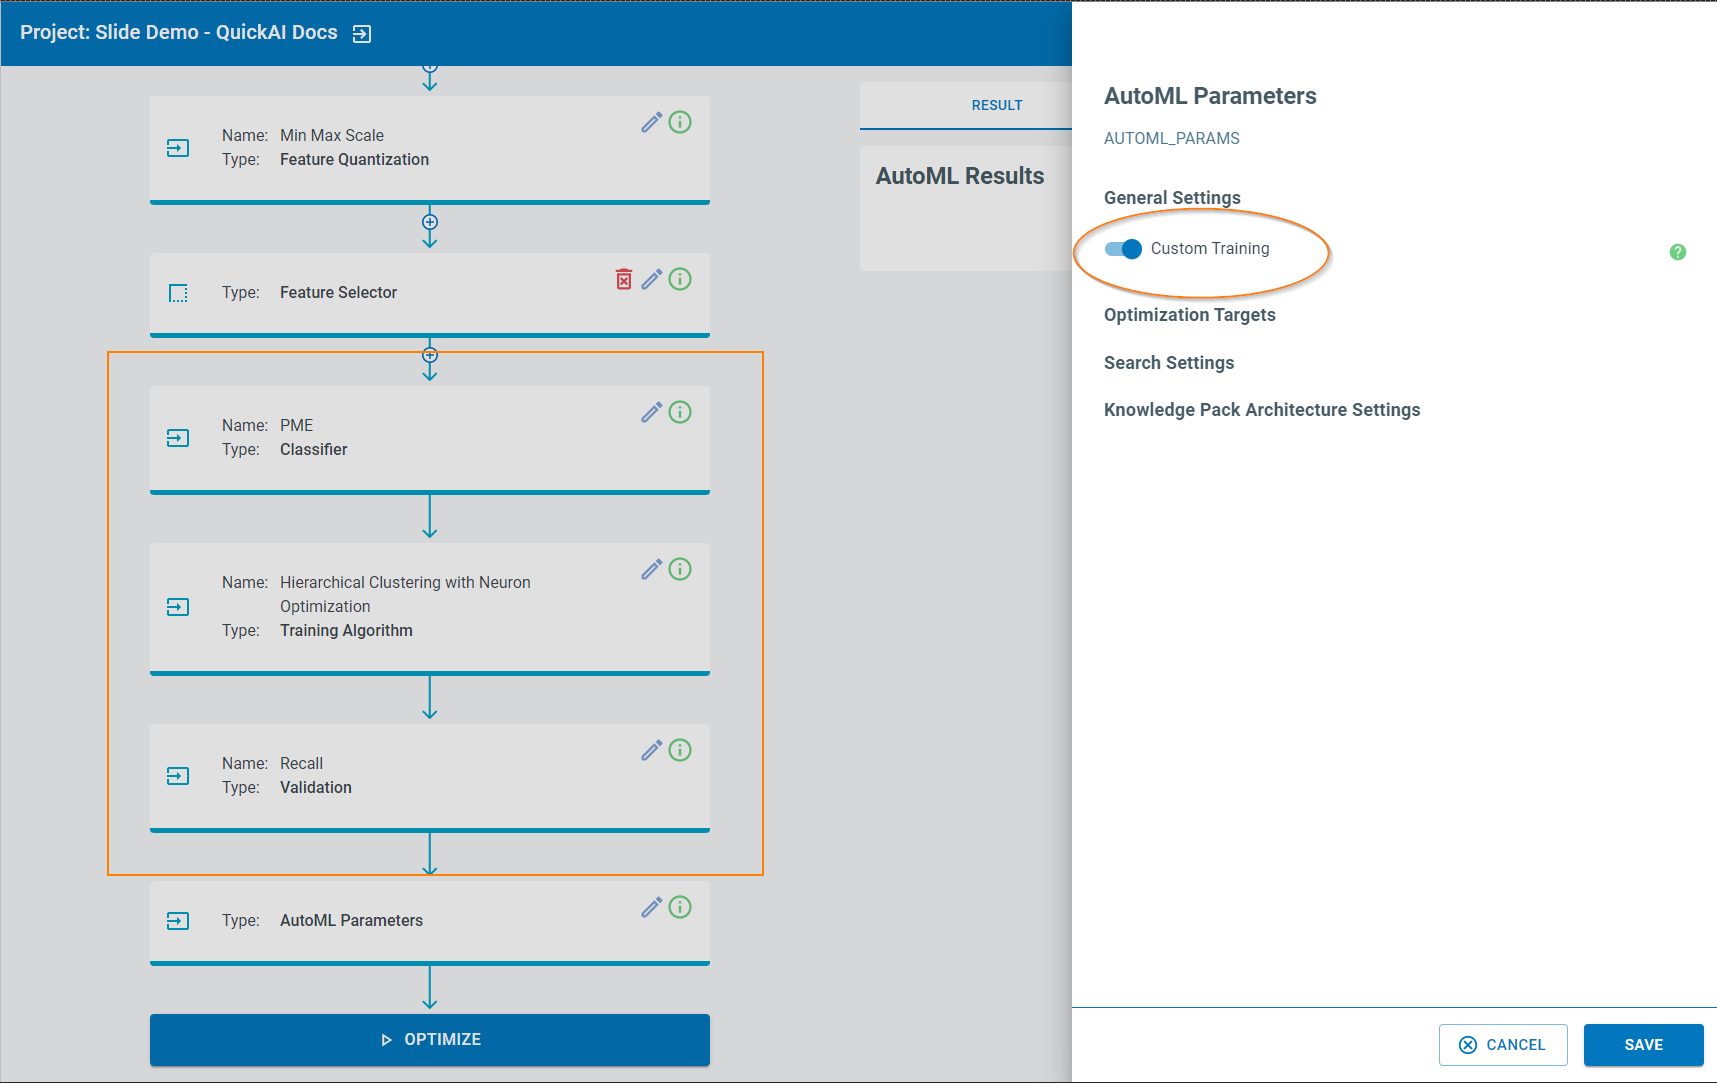
Added Custom Training mode to Pipeline Builder
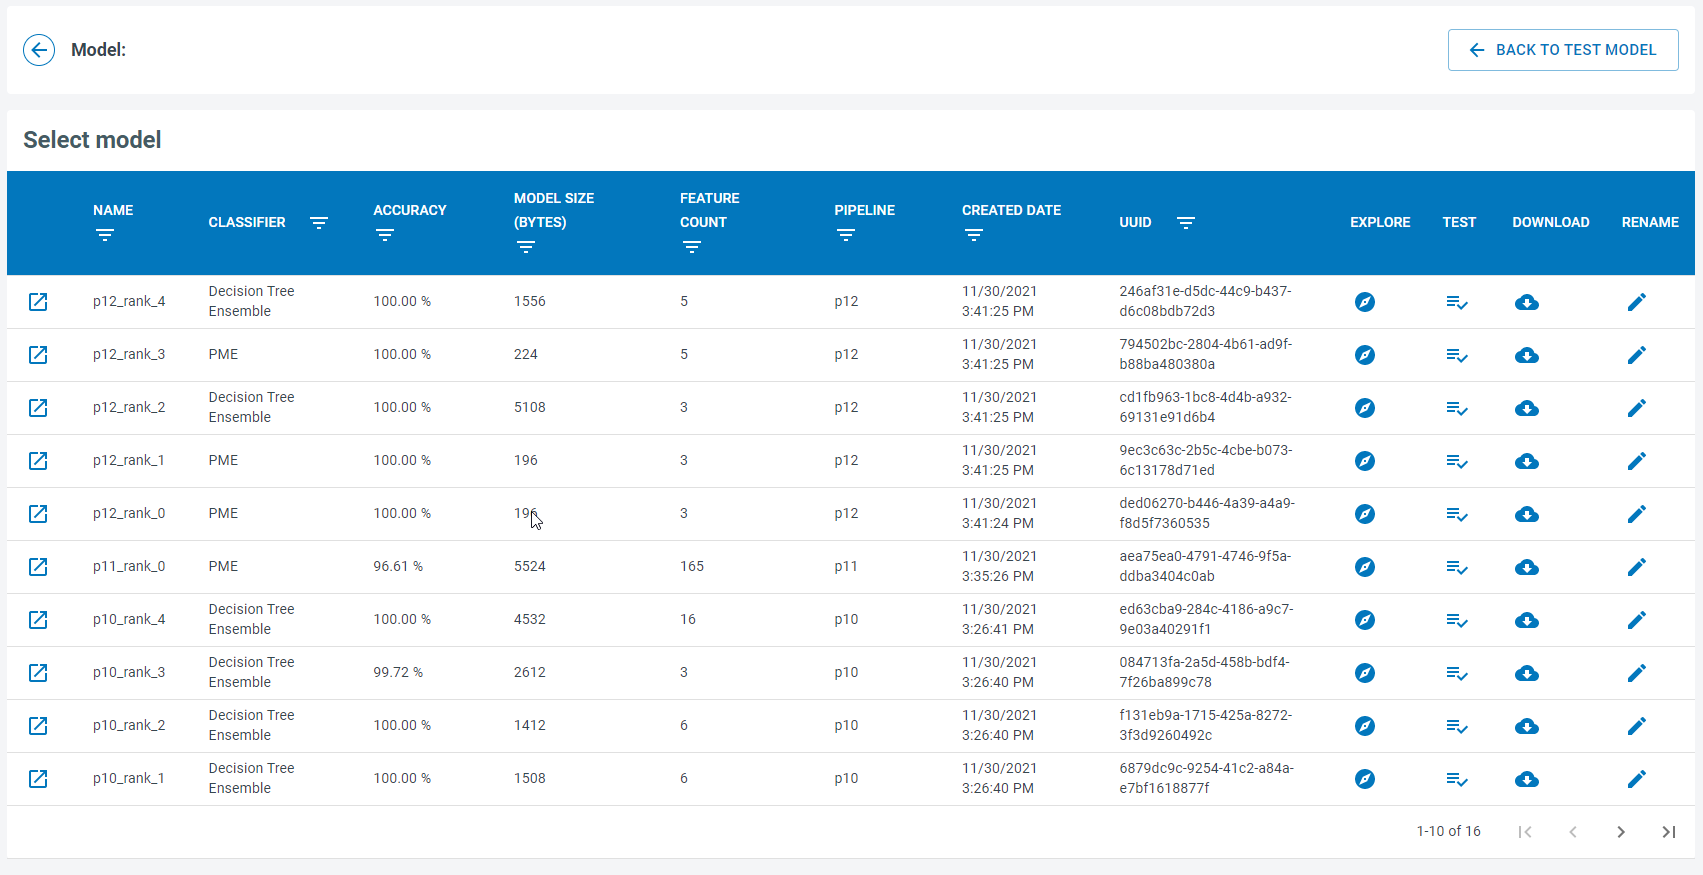
Added a new model selection screen and model navigation panel

Added handlers for updating columns according Feature Transform and Sensor Transforms at Pipeline Builder
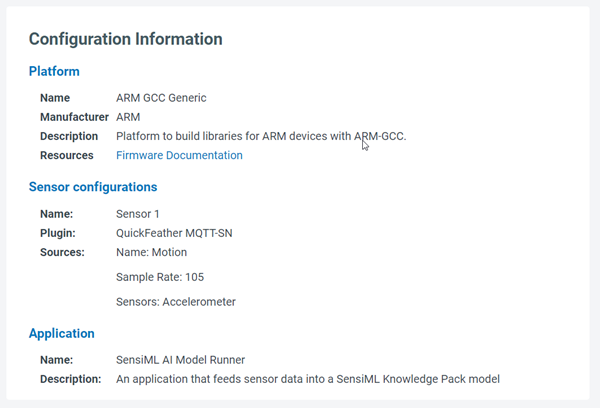
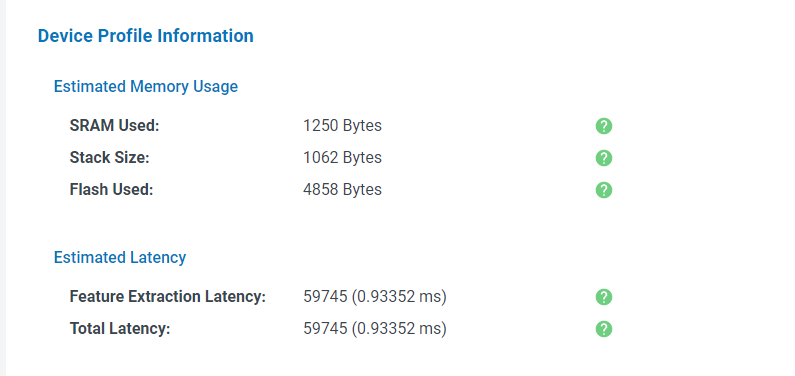
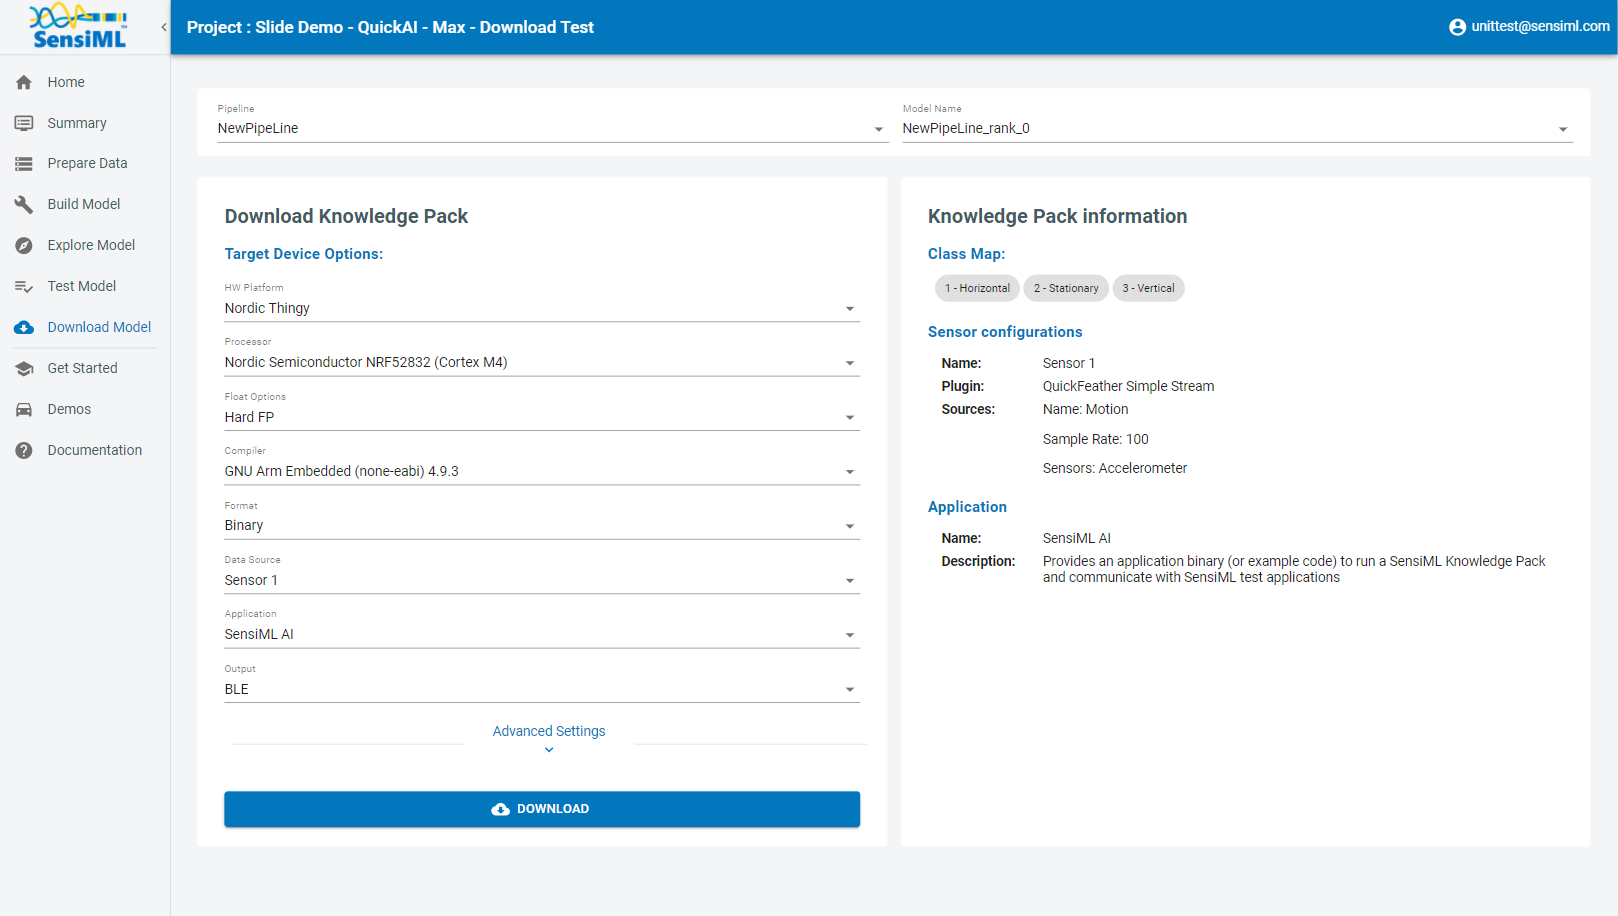
Added Device Profile Information to Download Model screen
Minor Features
Improved the code quality coverage
Updated status of cache at Query Summary table
Updated table styles
Optimized performance for Pipeline Builder screen
Bug Fixes
Fixed initial loading pipeline data after login
Fixed loading data after change user account
2021.3.11 (10/07/2021)
What’s New
Minor Features
Adds support for rebulding the query cache in the Query Summary table
Adds additional column information such as Created Date and UUID to the Query, Pipeline and Knowledge Pack summary tables
2021.3.10 (10/05/2021)
What’s New
Bug Fixes
Fixed issue in the AutoML builder view where default parameters didn’t contain SegmentID
Fixed login issue with redirecting to a source router if user use direct router link and have to login first
2021.3.7 (09/27/2021)
What’s New
Minor Features
Optimized project summary screen
Performance and styles improvments
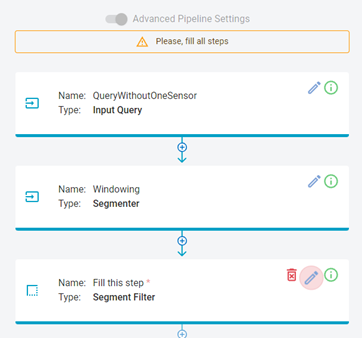
Show a warning message for incomplete pipelines in the AutoML builder
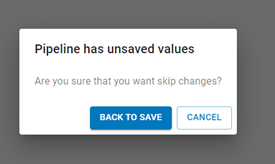
Added a warning message about unsaved data to AutoML builder
Bug Fixes
Fixed a bug in the Test Model screen where it could crash if some data was not yet loaded
Fixed a bug where logging into multiple accounts simultaneously was not loading loading project information correctly
2021.3.1 (09/14/2021)
What’s New
Major Features
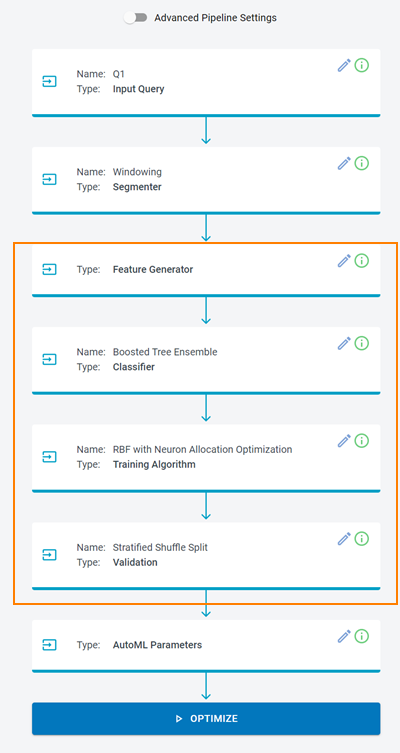
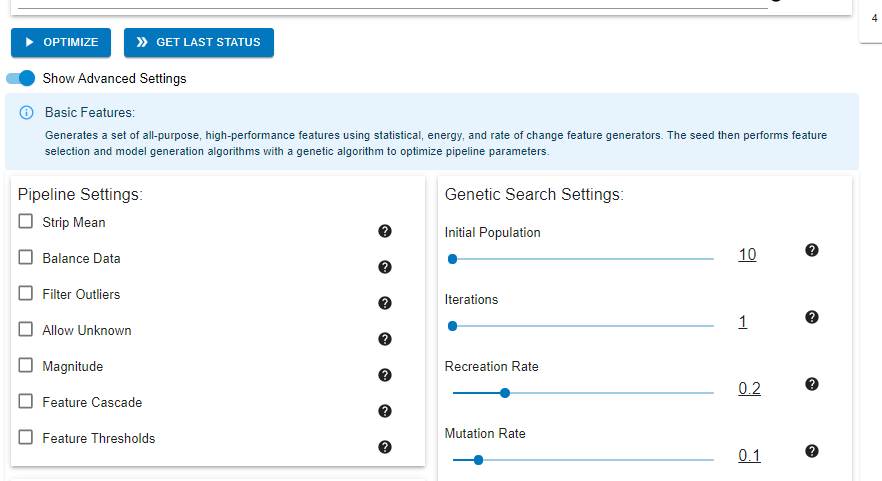
Adds a pipeline builder to construct DSP pipelines for AutoML model building
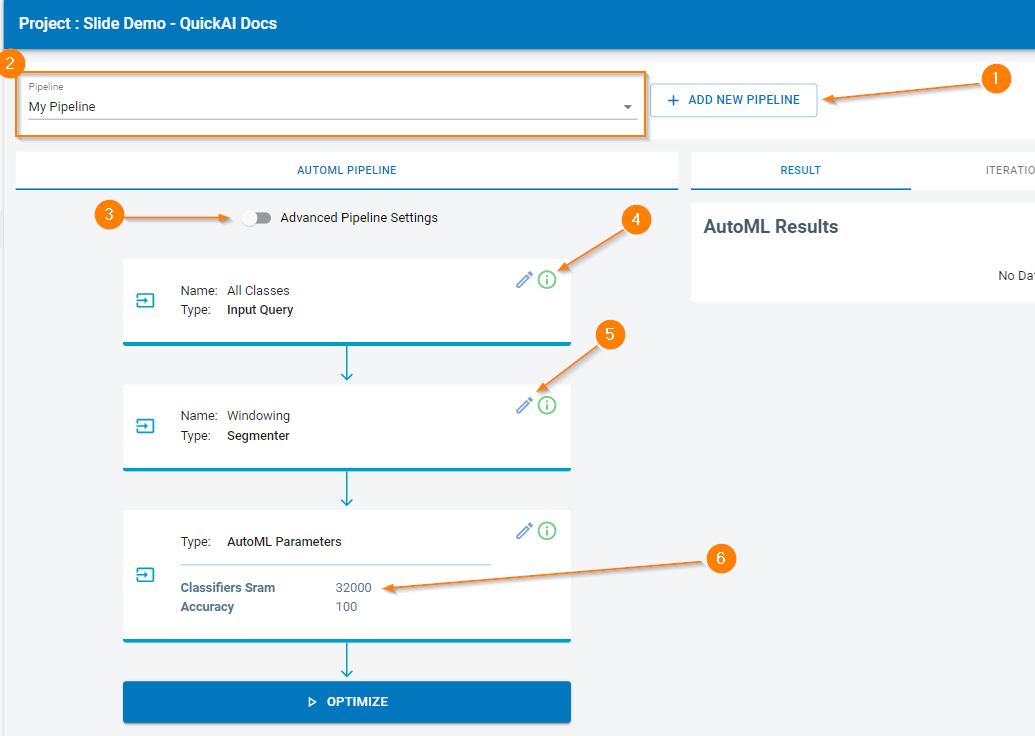
[1] Pipelines can be created with different combinations of steps and parameters
[2] The active pipeline can be changed on the selection list
Advanced Pipleine Options
[3] Enables an advanced mode that allows adding more steps and parameters
[5] Each step may be editable (exclude Input Data and steps that have been extracted from a session)
In addition to the default steps, additional steps can be added.
[6] Configure the AutoML hyperparameters for specific training algorithms, features, and classifier size limits.
Minor Features
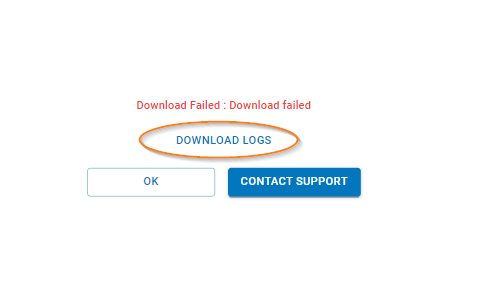
Added a button to load logs for Knowledge Pack files failed generation
Bug Fixes
Fixed logout bug at model building page
Fixed broken demo account flow
Fixed some performance and styles issues
2021.2.1 (08/19/2021)
What’s New
Implemented application routers
Updated styles for all pages
Optimized logic for loading data
Bug Fixes
Bug fixes at the store and api calls
2021.1.1 (08/05/2021)
What’s New
Optimized loading data after a user has logged in
Optimized refreshing for authorization auth token
Bug Fixes
Minor bug fixes at the store
Fixed some eslint errors
2021.1.0 (04/07/2021)
What’s New
New Download Model screen with supporting new version of platforms and Knowledge Pack information
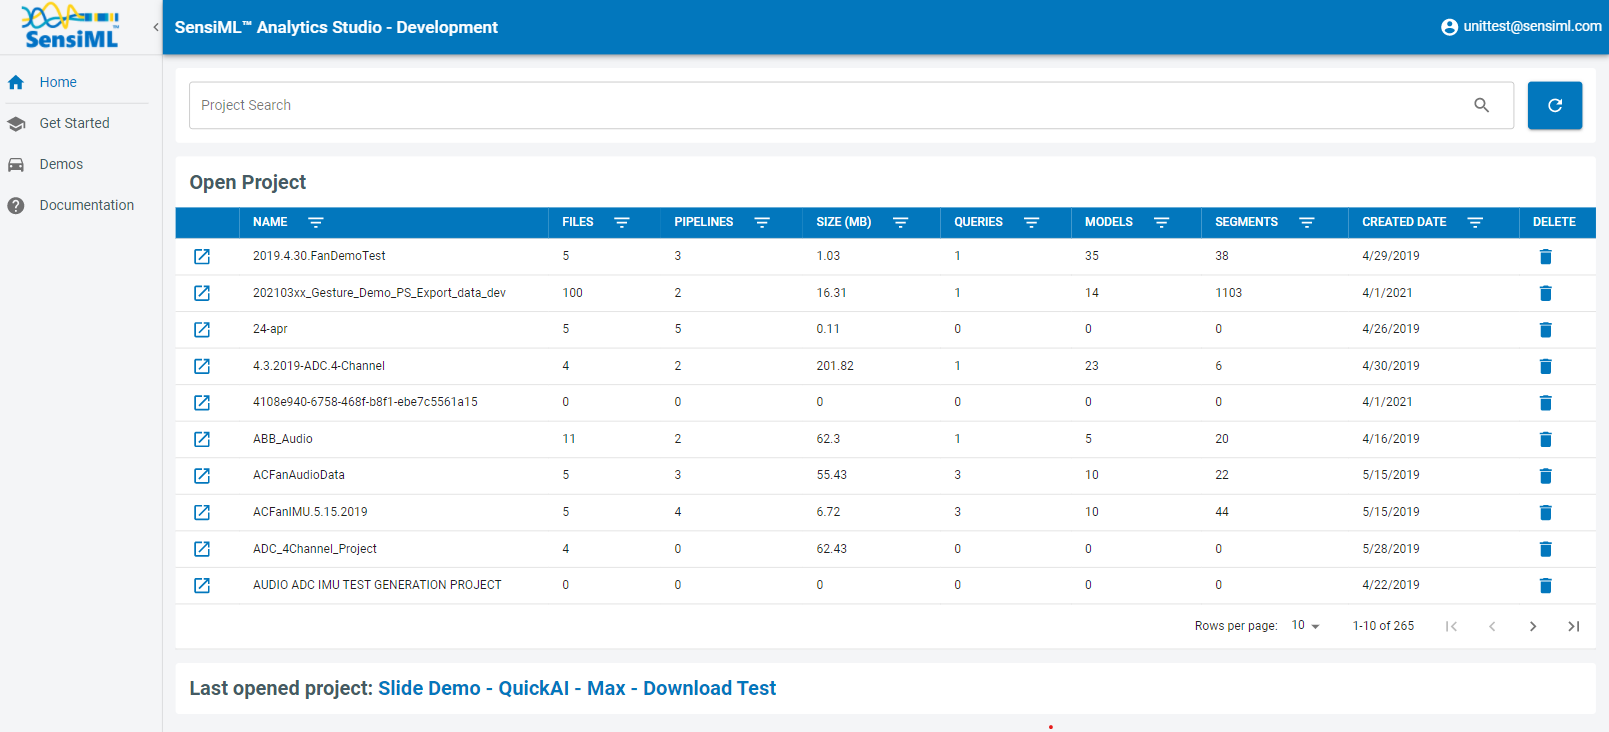
New Project screen styles with last opened project
Added support for localization
Bug Fixes
Minor bug fixes and security improvements
Fixed the issue with changing Pipelines and Model when the project is changing
Fixed behavior for expired auth token
2020.2.3 (01/11/2021)
What’s New
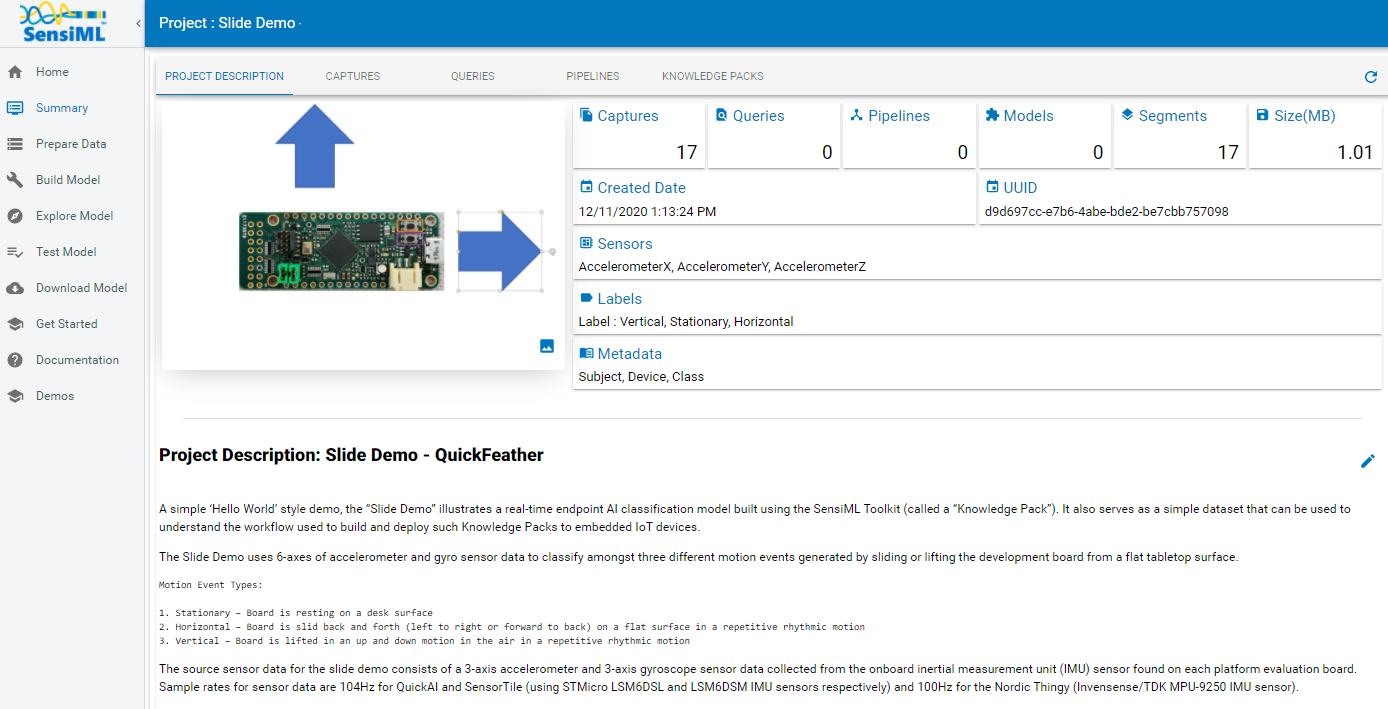
Adds a project description tab which includes project summary information as well as editable markdown field to describe your project.
Adds a number of Demos that can be accessed in read-only mode.
2020.2.2 (10/28/2020)
What’s New
The Advanced Settings tab has been moved to the bottom of the action buttons.
Enhanced Model Building Status Check to retry when a network issue occurs instead of returning a failure message.
Bug Fixes
Fixed an issue with the Query Filter in the Prepare Data view. If one of the metadata values is 0, the value was being removed from the query filter.
Fixed the Default Query Selection in the Build Model view for projects with a non-custom segmenter.
Fixed an issue where the magnitude column was duplicated when using Query Segments and Custom Feature Generator set.
Feature Threshold selection was not being persisted on the pipeline. This issue has been fixed.
The rename feature in the Knowledge Pack tab in the Project Summary view, renames the selected model’s name. In the case of a hierarchical model, all child model names needed to be prefixed with the parent model name. This issue has been fixed.
Fixed an issue with the Feature Vector Distribution Graph in the Explore Model View. The chart was not changing to the child model’s data when users switched to the child model tabs.
For hierarchical models, the parent model KP description details were not being posted back to the server with the Test Model run request. This issue has been fixed.
2020.2.1 (10/07/2020)
What’s New
Enhancements to the Model Explorer view
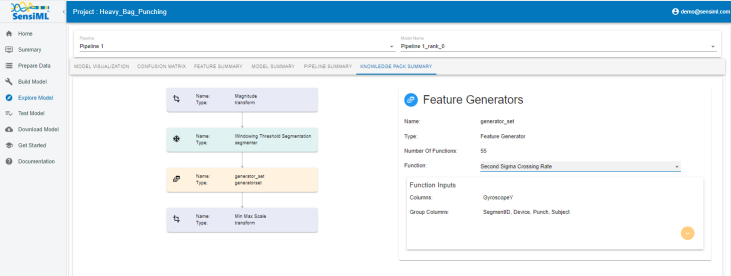
Added Pipeline Summary to the Explore Model Screen, showing the pipeline flow and step details.
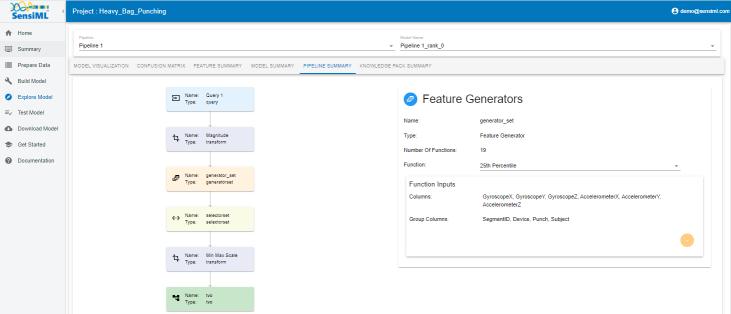
Added Knowledge Pack Summary to the Explore Model Screen, showing the steps and step details used to generate the Knowledge Pack.
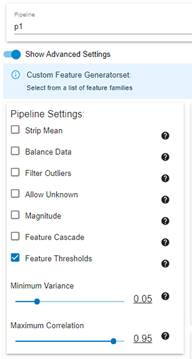
Added variance and correlation based feature thresholds to the advanced settings in the Model Building view.
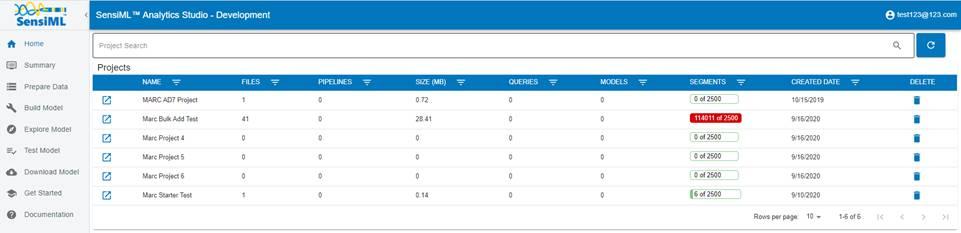
Enhanced the Projects table by adding a segment count column. Starter Licenses are limited to 2500 segments per project. For Starter Licenses, the segments column will show a usage indicator of the number of segments used for the project.
2020.2.0 (09/16/2020)
What’s New
Enhancements to the Project Summary view
Moved all summary tables into a single tab view and defaulted to displaying 10 rows per table.
Create and Modified Date columns are added to the Queries and Pipelines Summary tables.
Added a Knowledge Pack counts column to the Pipeline Summary table showing the number of Knowledge Packs for the pipeline.
Knowledge Pack summary table is enhanced to show Accuracy, Classifier, Model Size and Feature Counts.
Moved the “Refresh Summary” button to the bottom of the tab view.
Changed default sorting on the Query and Pipeline Summary tables to sort by the latest last modified date column and the Knowledge Pack summary table by the created date column.
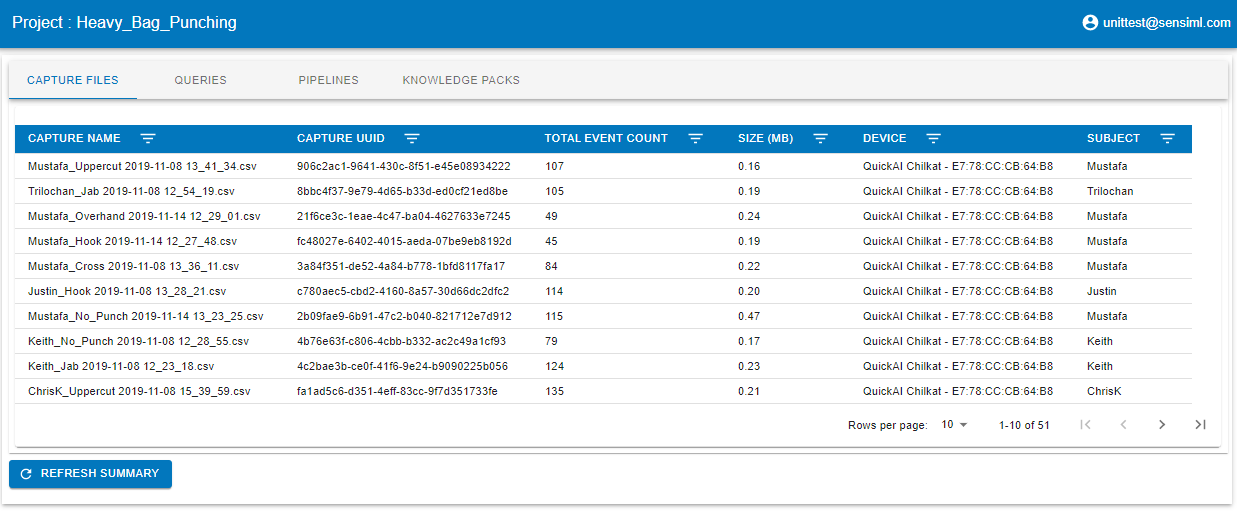
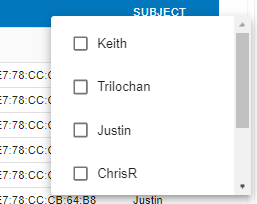
Enhanced the Captures Files Table to show metadata data marked for lookup as drop-down filters.
Applied color gradient based on the ratio of value to support in the Confusion Matrix.
Title shows the Project Name on all screens except for the Home Screen.
Bug Fixes
Fixed issue in the Download Model view where the default Target OS selection for Cortex M4 was not correct.
2020.1.5 (08/19/2020)
What’s New
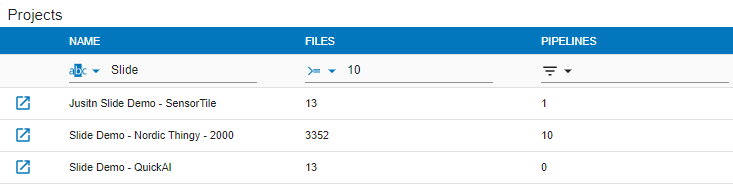
Enhanced Project and Capture Statistics tables with advanced filtering capabilities and type aware filter options (Date, Text, and Numeric Filters).
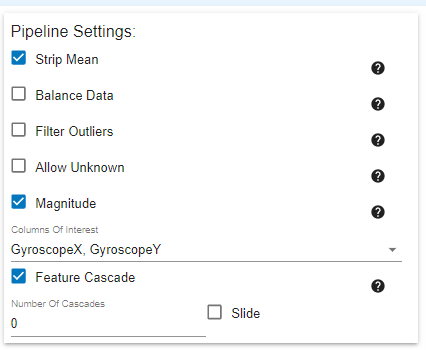
Added Feature Cascade, Strip Mean, and Magnitude Transforms to the Model Building View.
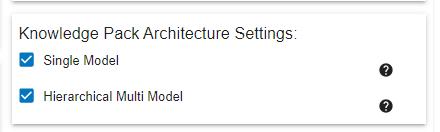
Added ability to select a Knowledge Pack Architecture in the Model Building View. You can select between a Single or Hierarchical Multi-Model or both.
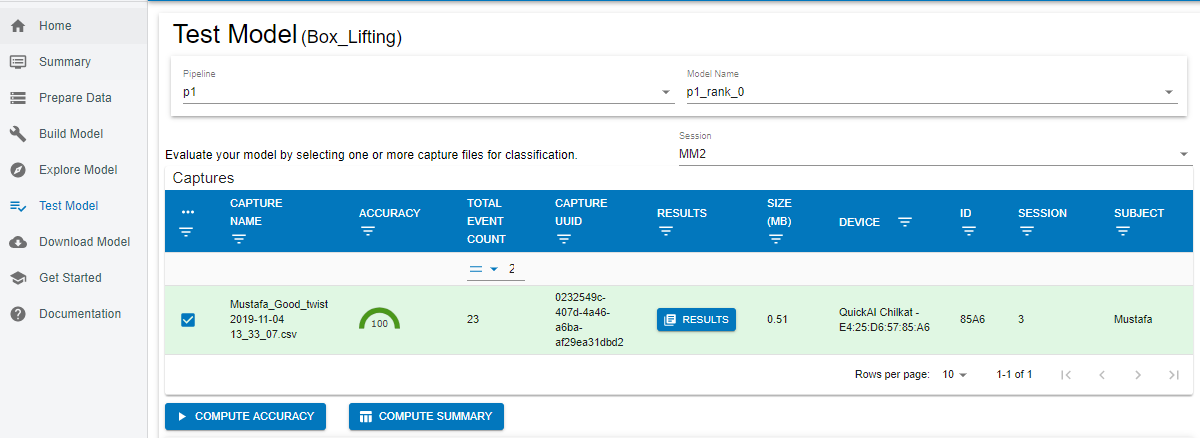
Added an enhanced experience for Model Testing.
Test Model menu displays a new section for model testing.
You can now sort and filter, capture files on all capture attributes and metadata fields.
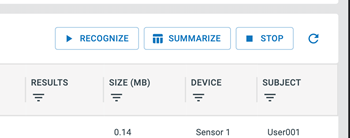
Multiple capture files can be selected to simultaneously run signal recognition.
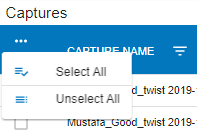
Added a menu for selecting/unselecting all capture files.
Enabled selection of any session and model on the project to run the capture files to run signal recognition and compute the accuracy.
Accuracy is displayed in the table after signal recognition.
Capture row is color highlighted to show if accuracy is above 80% (green) or below 80% (red) or grey (when no ground truth data is provided).
Added ability to compute a summary confusion report of selected capture files run’s.
Enhanced Model Test Results.
Classification Results are displayed when the results button is clicked.

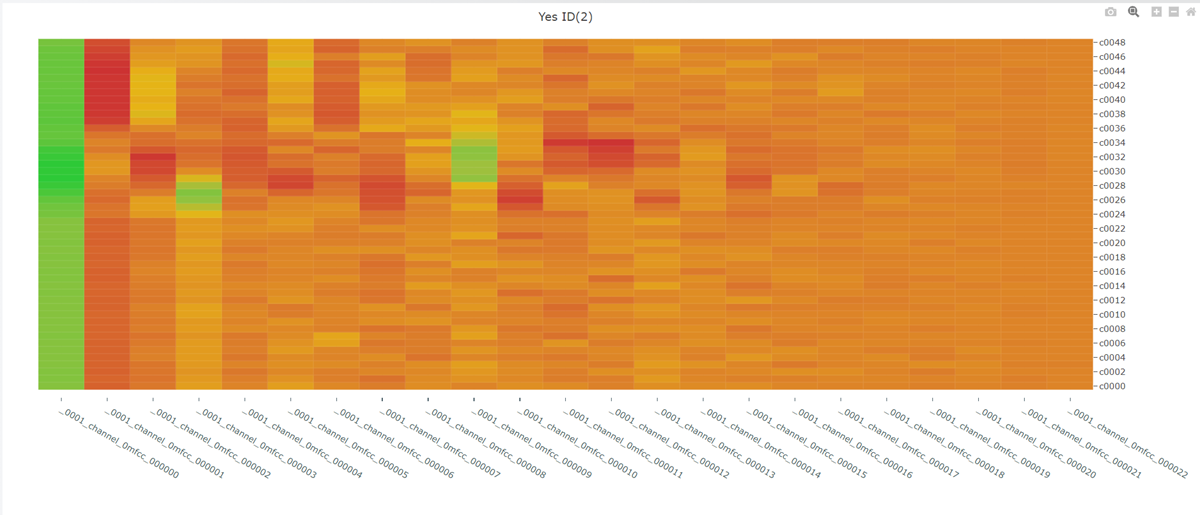
The results section consists of a confusion matrix, a classification chart showing the ground truth and predictions for the segments, and a feature vector heat map showing the feature values for a given feature and segment.
Enabled synchronous hover on the classification chart and feature vector heatmap, when hovered over the heat map the predicted event for the segment is displayed in the classification chart.
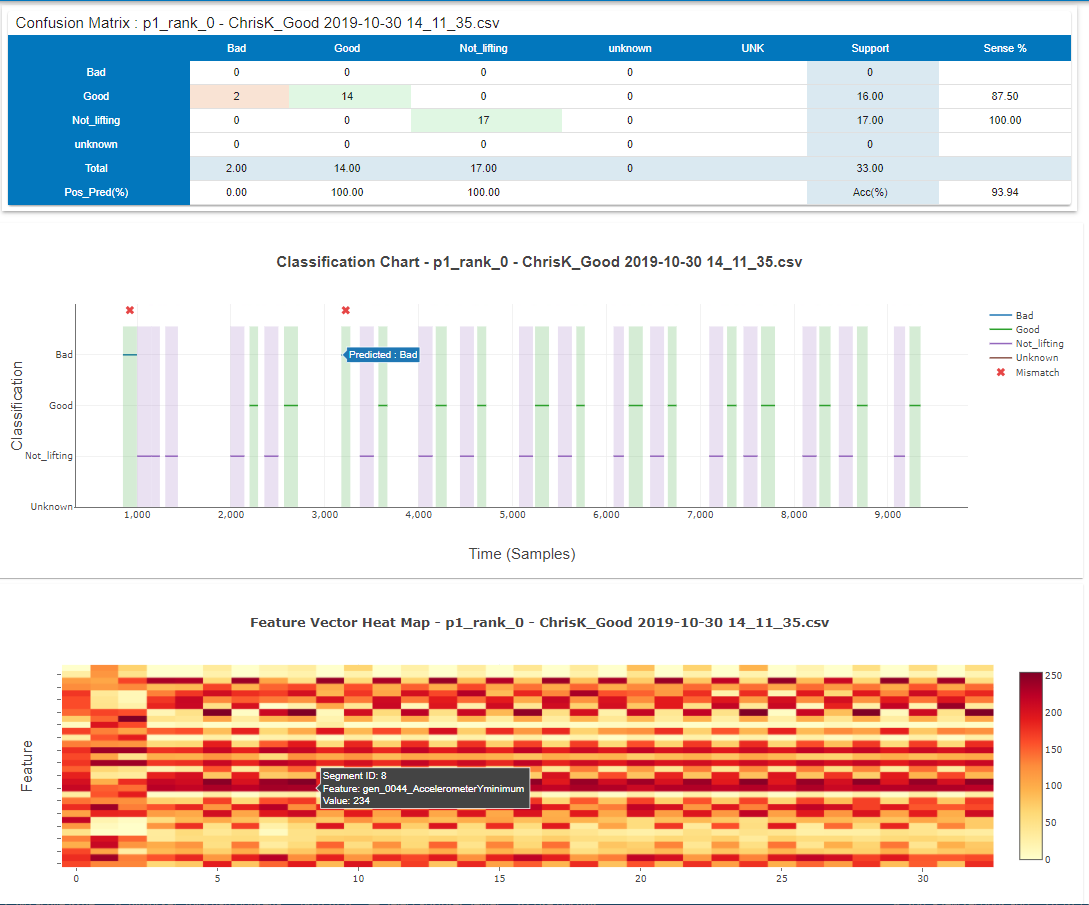
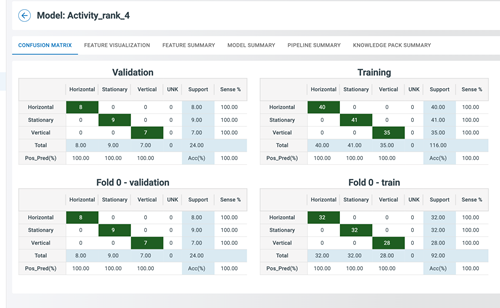
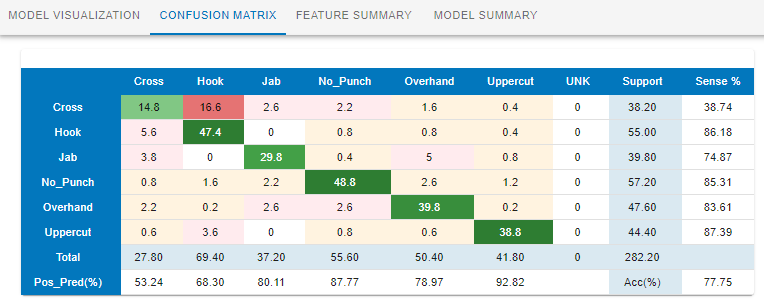
Enhanced Confusion Matrix.
Diagonal cells in the Matrix with data are highlight green and non-diagonal data cells are highlighted red.
UNC column has been removed from the table and Sense Perc will only be displayed when Support is greater than 0.
Accuracy will only be displayed when there is ground truth data.
All decimal values in the matrix are rounded to 2 decimals.
2020.1.4 (06/22/2020)
What’s New
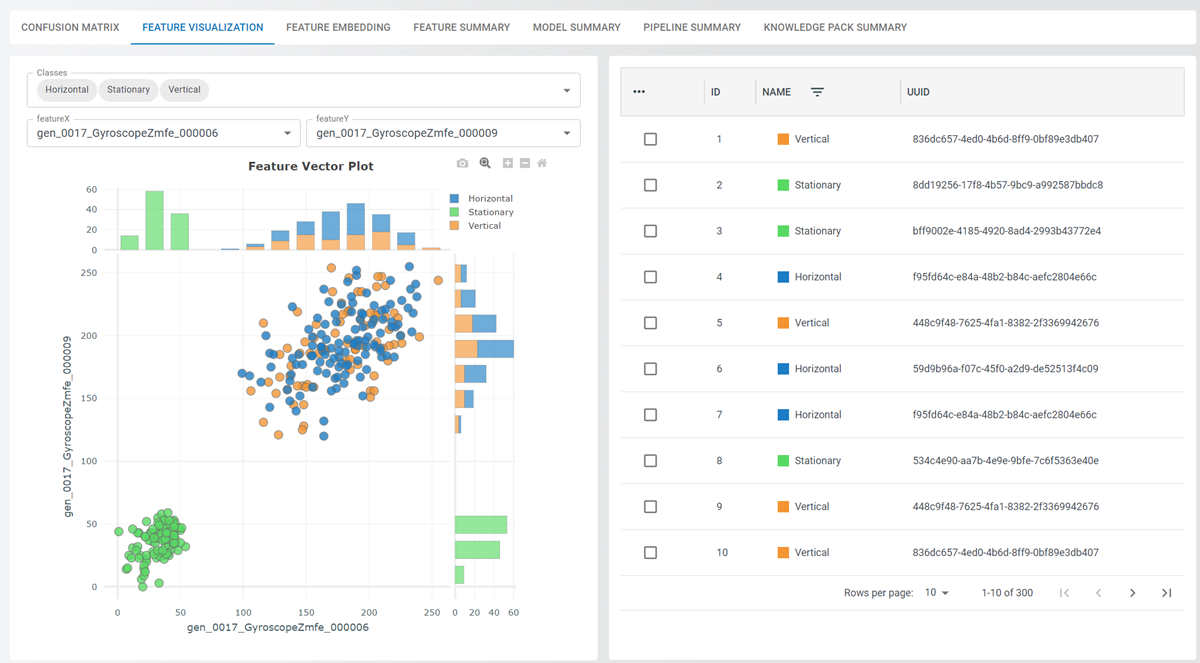
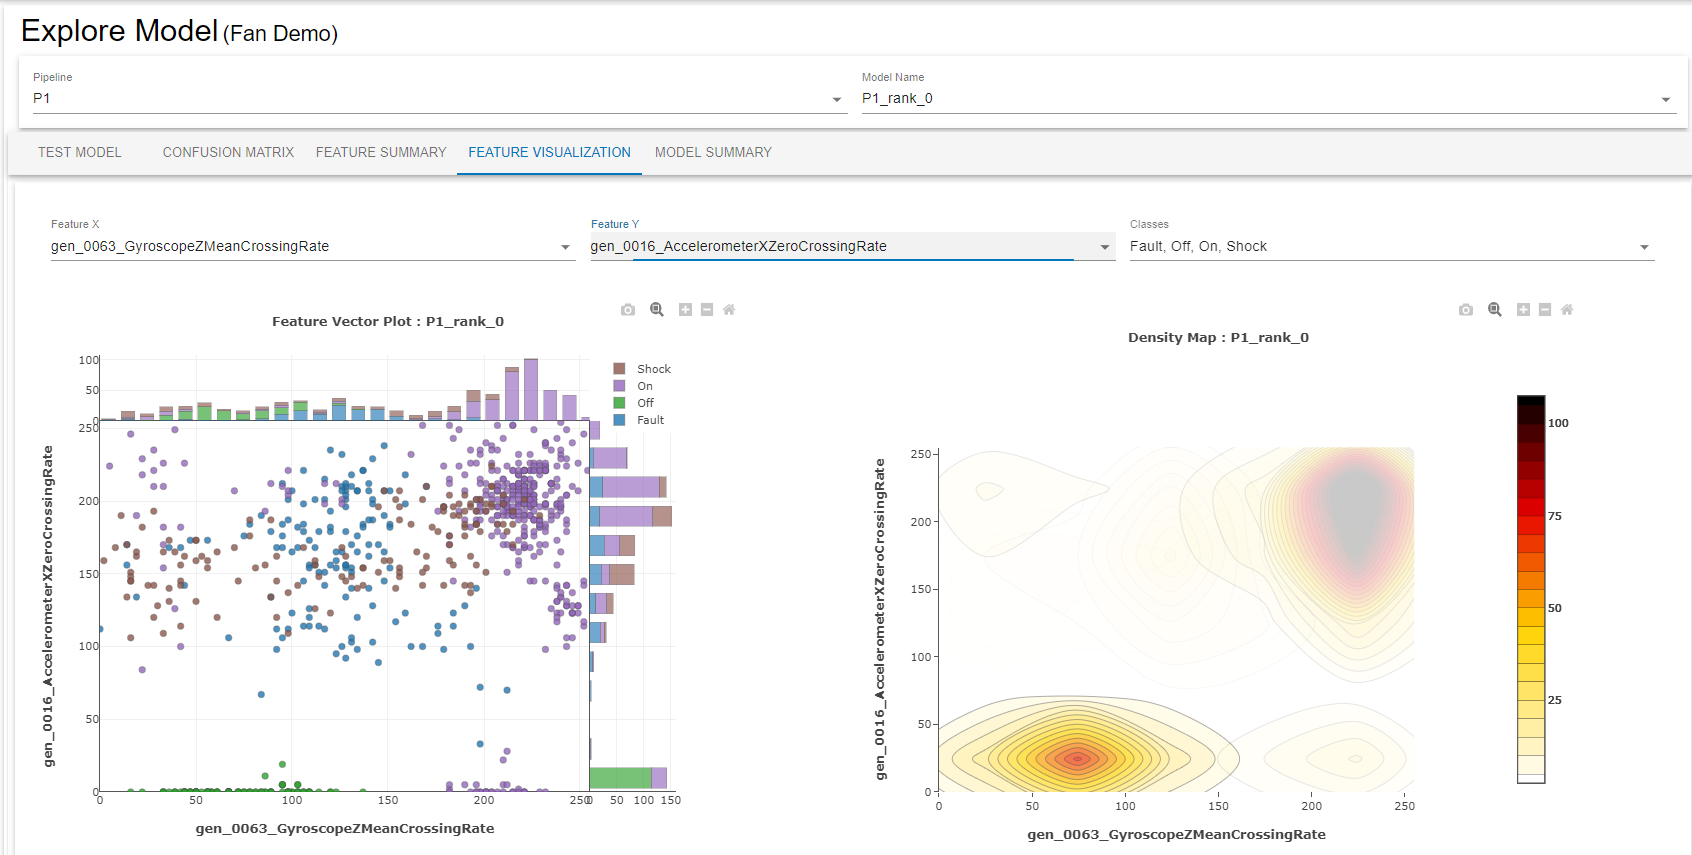
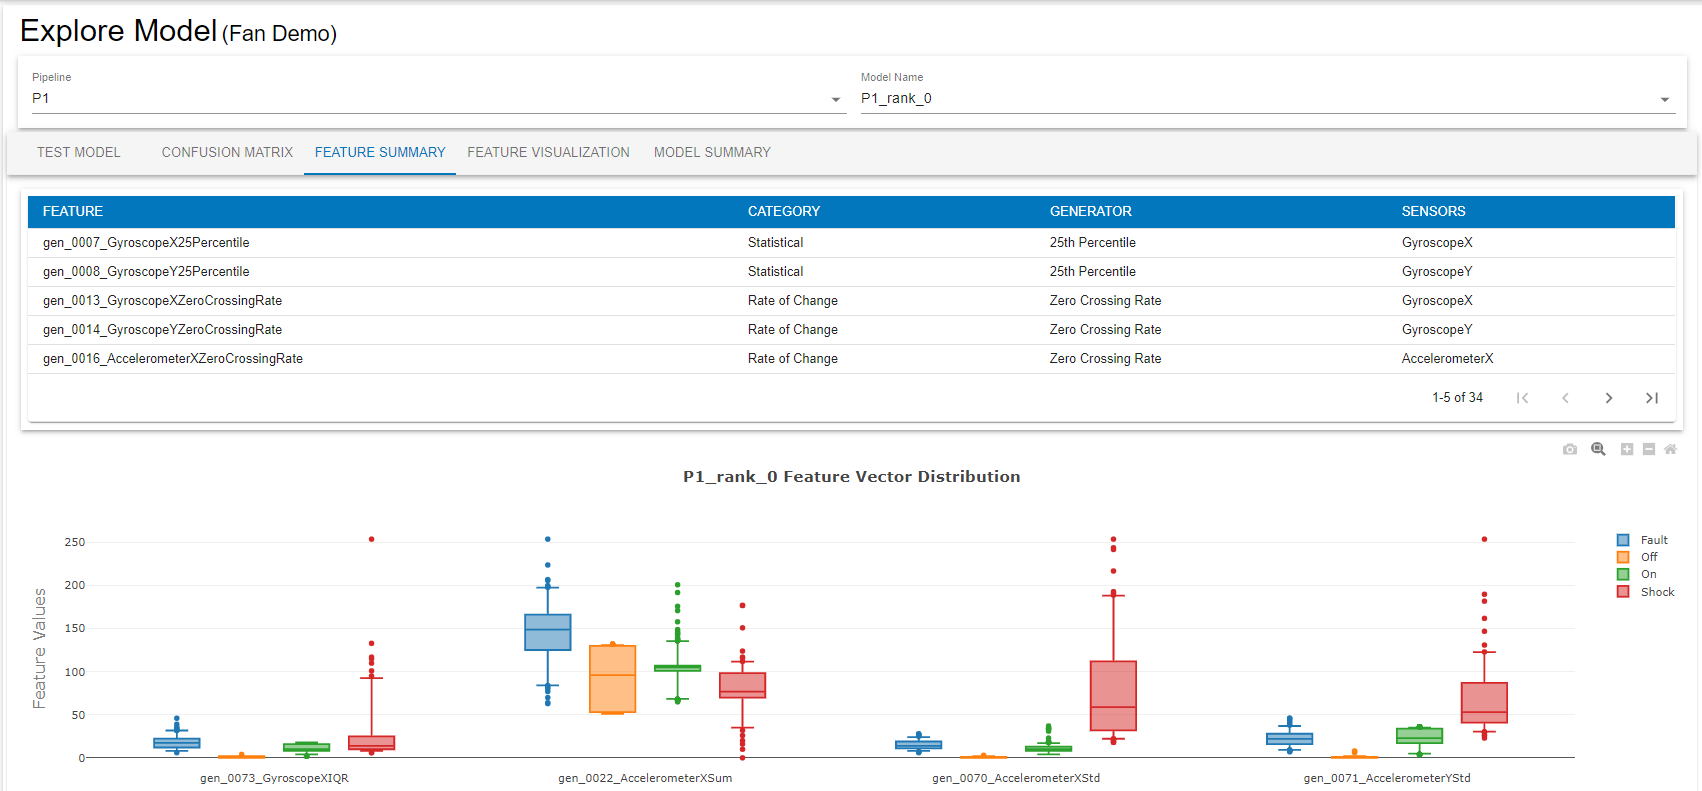
Added visualizations to the Model Explore Screen.
Feature Vector Plots added under the Feature Visualization Tab.
Feature Vector Distribution Plots added under the Feature Summary Tab.
Added a button to the project list view to allow users to refresh the project list
Enhanced the Confusion Matrix labels to highlight diagonal cells and total row/columns.
Enhanced the query creation flow to select all the sources by default when a new query is created.
Metadata selection list is now sorted alphabetically in the Data Exploration view.
2020.1.3 (05/20/2020)
What’s New
Added a ‘Get Started’ link to provide an overview of the tool to new users
Enhanced the Confusion Matrix to show row labels in as-is casing instead of all caps
Classification Chart now have all the labels for the query
Added a button to stop a classification run
2020.1.2 (05/04/2020)
What’s New
Added a ‘delete’ column to project list view with action buttons for project deletion
Breakup of the Status log error message by line breaks in the Model Building page
Enhancements to the Model Building view to enable persistence of the Build/Optimization settings for the pipeline
Bug Fixes
Fixed Issue with project statistics table, where it was not resizing when the Nav bar is collapsed
Fixed issue with Explore Model -Test Model - Charting and optimized server calls to eliminate extraneous sever requests across the application