Querying Data
The query is used to select your sensor data from your project. If you need to filter out certain parts of your sensor data based on metadata or labels, you can specify that here.
Creating a Query
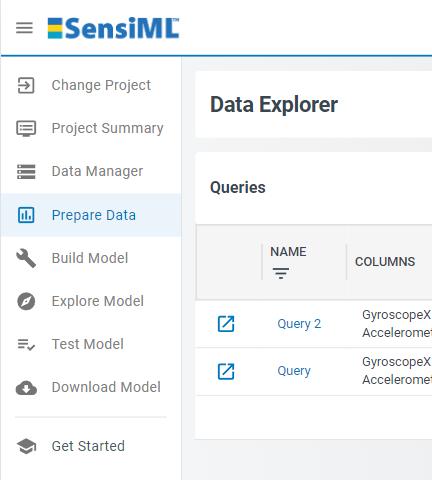
Open the Prepare Data screen to create a query
Create a new query with the session and labels you wish to use in your project
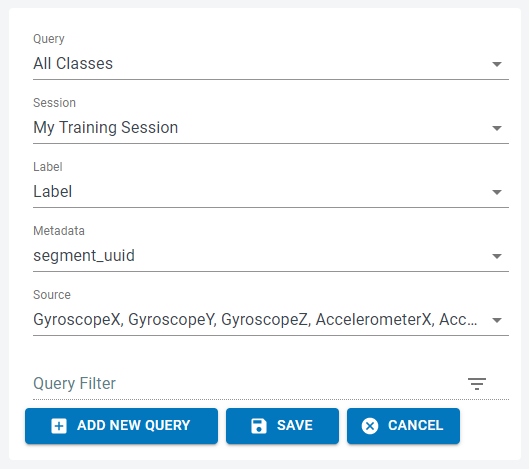
Click Save and the Analytics Studio will count all the events of interest you have labeled in this project and graph them
The graph will look similar to this:
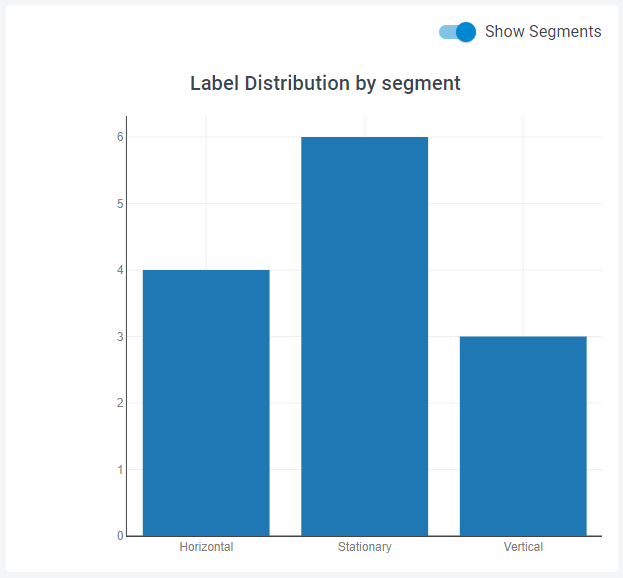
The x-axis shows the events in the query and the y-axis shows how many events you selected
Query Filter
If you are working with your sensor data and you discover certain events of interest are bad or not useful you can ignore them in your query by using the Query Filter. If you have ever used a database query before then this syntax may be familiar to you.
In the Slide Demo if you wanted to ignore the Vertical events, you can add the filter:
[Label] IN [Horizontal, Stationary]
You can also filter the metadata values using the Query Filter. In the Slide Demo you can add a Subject filter
[Label] IN [Horizontal, Stationary] AND [Subject] IN [User001]
This filter would only select the Horizontal and Stationary events done by User001