DCLProject
The DCLProject API lets you analyze and access sensor data stored in the Data Studio .DCLPROJ format. DCLPROJ files are what the Data Studio uses to save your labeled sensor data.
First, we will import and instantiate the DCLProject object. Then, we are going to create a connection to your DCLPROJ file. This will give us access to the information in the DCL so we can more easily perform our analysis.
Note
The API is read-only and does not make any modifications or updates to the DCLPROJ file.
from sensiml.dclproj import DCLProject

dclproj_path = '<PATH-To-File.dclproj>'

dcl = DCLProject(path=dclproj_path)
There are several useful functions in the DCLProject API that will let you explore the data sets. You will be able to see information about each session of labeled data, captured data files, as well as the segments of data. Let’s start by listing the sessions that are in this project.
dcl.list_sessions()
| id | name | parameters | custom | preprocess | created_at | local_status | last_modified | |
|---|---|---|---|---|---|---|---|---|
| 0 | 1 | pose_estimation_2 | None | 1 | None | 2021-09-28 17:12:19.340477 | Synced | 2021-09-28 17:12:19.340494 |
| 1 | 3 | auto_train_session2 | {"inputs":{"input_data":"","first_column_of_in... | 0 | {} | 2021-09-24 17:18:55.405671 | Synced | 2021-09-24 18:20:59.227769 |
| 2 | 7 | general_abs_sum | {"inputs":{"input_data":"","first_column_of_in... | 0 | {} | 2021-09-30 23:44:21.626028 | Synced | 2021-09-30 23:50:41.601792 |
| 3 | 8 | Test | None | 1 | None | 2021-10-01 20:46:42.223753 | Synced | 2021-10-01 20:46:42.223778 |
As you can see there are two sessions in this project. The first one is what we call a custom or manual session, this means that the labels were manually placed by the user. The second one is what we call an auto session, which means the labels were created by a segmentation algorithm.
Next, we will list the segments that are part of the “auto_train_session2” session. To do this we will use the list_capture_segments API.
dcl.list_capture_segments(session= "auto_train_session2")
| capture..start | capture..end | last_modified | segmenter | capture | label_value | |
|---|---|---|---|---|---|---|
| 0 | 707 | 957 | 2021-09-29 00:03:17.659838 | auto_train_session2 | stand_start_3.csv | normal |
| 1 | 618 | 868 | 2021-09-29 00:05:37.647696 | auto_train_session2 | stand_start_1.csv | Unknown |
| 2 | 625 | 875 | 2021-09-29 00:03:17.660063 | auto_train_session2 | reach_lift_3.csv | normal |
| 3 | 624 | 874 | 2021-09-29 00:05:37.647696 | auto_train_session2 | reach_lift_1.csv | Unknown |
| 4 | 628 | 878 | 2021-09-29 00:05:37.647696 | auto_train_session2 | reach_lift_0.csv | Unknown |
| 5 | 629 | 879 | 2021-09-29 00:03:17.659923 | auto_train_session2 | lift_stand_3.csv | normal |
| 6 | 671 | 921 | 2021-09-29 00:05:37.647696 | auto_train_session2 | lift_stand_1.csv | Unknown |
| 7 | 680 | 930 | 2021-09-29 00:05:37.647696 | auto_train_session2 | lift_stand_0.csv | Unknown |
| 8 | 637 | 887 | 2021-09-29 00:03:17.660142 | auto_train_session2 | start_reach_3.csv | normal |
| 9 | 825 | 1075 | 2021-10-01 21:07:03.549009 | auto_train_session2 | unknown_reach_start_7.csv | start |
This provides information about the segments in the captured file. We will pick one of the files and generate a plot which combines the data and the segments for that capture. To do this we will use the plot_segment_labels API. Next, pass a capture name and the session name into the plot_segment_labels API.
df = dcl.plot_segment_labels(["lift_stand_2.csv"], "auto_train_session2")
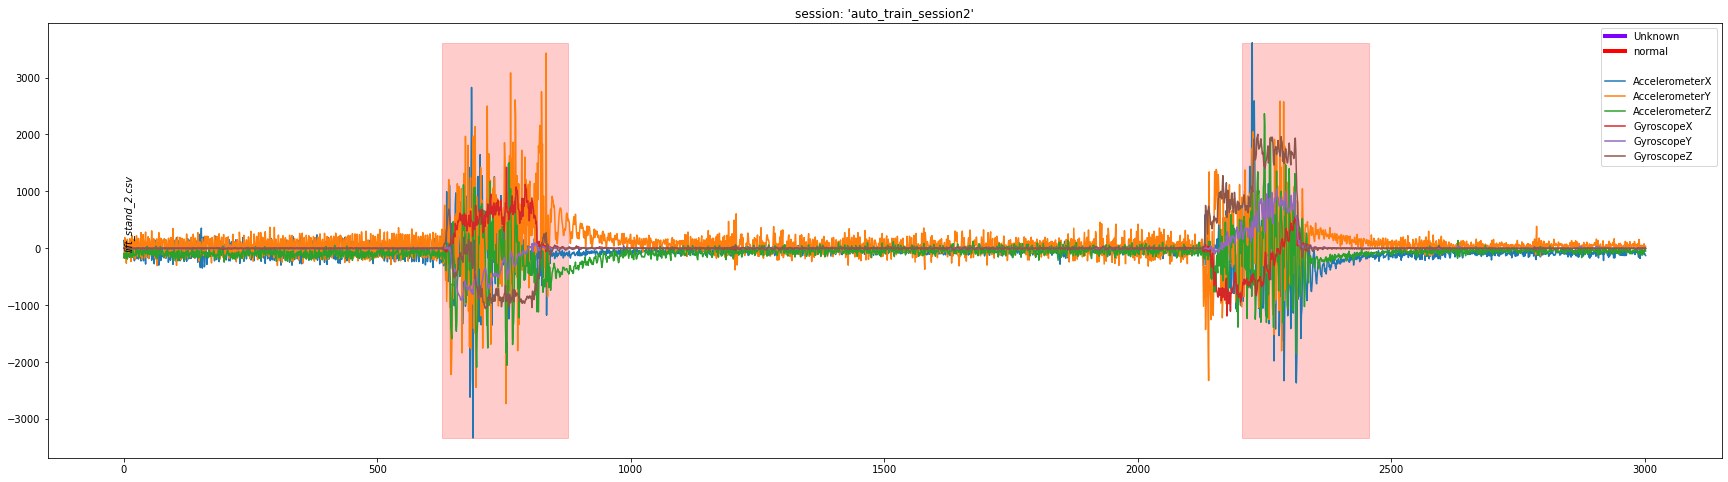
This generates the above plot and stores data into the df object. df is a DataFrame containing the sensor data from those captures.
Next, we will get the information for the segments for this particular file. To do that we can use the get_capture_segments API.
segments = dcl.get_capture_segments("lift_stand_2.csv", "auto_train_session2")
This returns a DataSegments object, which is a list of DataSegment objects with some additional functionality. To see a plot of all the segments in the DataSegments object, you can call plot API.
segments[0].plot()
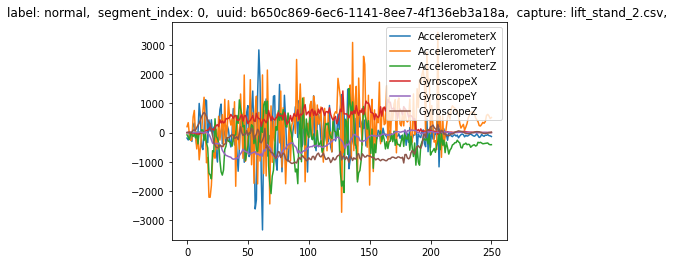
Additionally, you can index into the DataSegments to see more detailed information about each segment.
segments[0].metadata
{'label': 'normal',
 'segment_index': 0,
 'uuid': UUID('b650c869-6ec6-1141-8ee7-4f136eb3a18a'),
 'capture': 'lift_stand_2.csv'}
segments[0].to_dataframe()
| AccelerometerX | AccelerometerY | AccelerometerZ | GyroscopeX | GyroscopeY | GyroscopeZ | |
|---|---|---|---|---|---|---|
| 0 | -189 | 200 | -79 | -7 | -2 | 2 |
| 1 | -254 | 338 | -161 | 8 | -8 | 8 |
| 2 | -25 | -97 | -235 | 21 | 0 | -10 |
| 3 | 1 | -273 | -52 | 9 | 9 | -28 |
| 4 | -303 | -237 | -65 | -23 | 1 | 17 |
| ... | ... | ... | ... | ... | ... | ... |
| 246 | -93 | 586 | -358 | 1 | 1 | -23 |
| 247 | -71 | 621 | -356 | -2 | 0 | -17 |
| 248 | -106 | 570 | -400 | 4 | 3 | -10 |
| 249 | -113 | 478 | -417 | 4 | 0 | 0 |
| 250 | -136 | 513 | -415 | 2 | -2 | 12 |
251 rows × 6 columns
segments[0].columns
Index(['AccelerometerX', 'AccelerometerY', 'AccelerometerZ', 'GyroscopeX',
       'GyroscopeY', 'GyroscopeZ'],
      dtype='object')
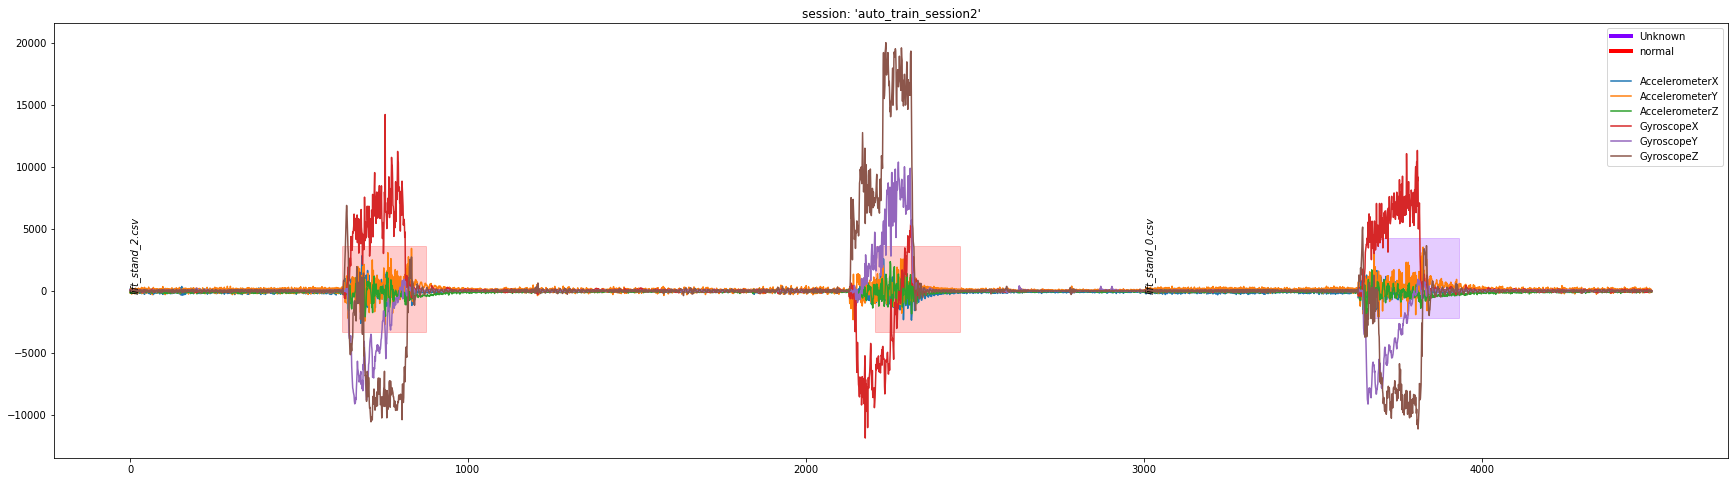
Finally, we will look at how to apply some transforms to the sensor data and plot the results. We will create two functions, one that generates a new column (the magnitude) and one that scales the data in place.
You can see the example below for how to create these two types of transforms. One of them applies to data inline, the other creates a new column. You can chain one more together as needed.
def mag_columns(x):
    return x[['AccelerometerX', 'AccelerometerY', 'AccelerometerZ']].sum()*0.058501749436316454

def scale_columns(x):
    return x[['GyroscopeX','GyroscopeY', 'GyroscopeZ']]*10


mag_columns_def = {'name':'mag','func':mag_columns, "type":'transform'}
scale_columns_def = {'name':'filter','func':scale_columns, "type":'filter', "columns":['GyroscopeX','GyroscopeY', 'GyroscopeZ']}
df = dcl.plot_segment_labels(["lift_stand_2.csv", "lift_stand_0.csv"], "auto_train_session2", transforms=[scale_columns_def])
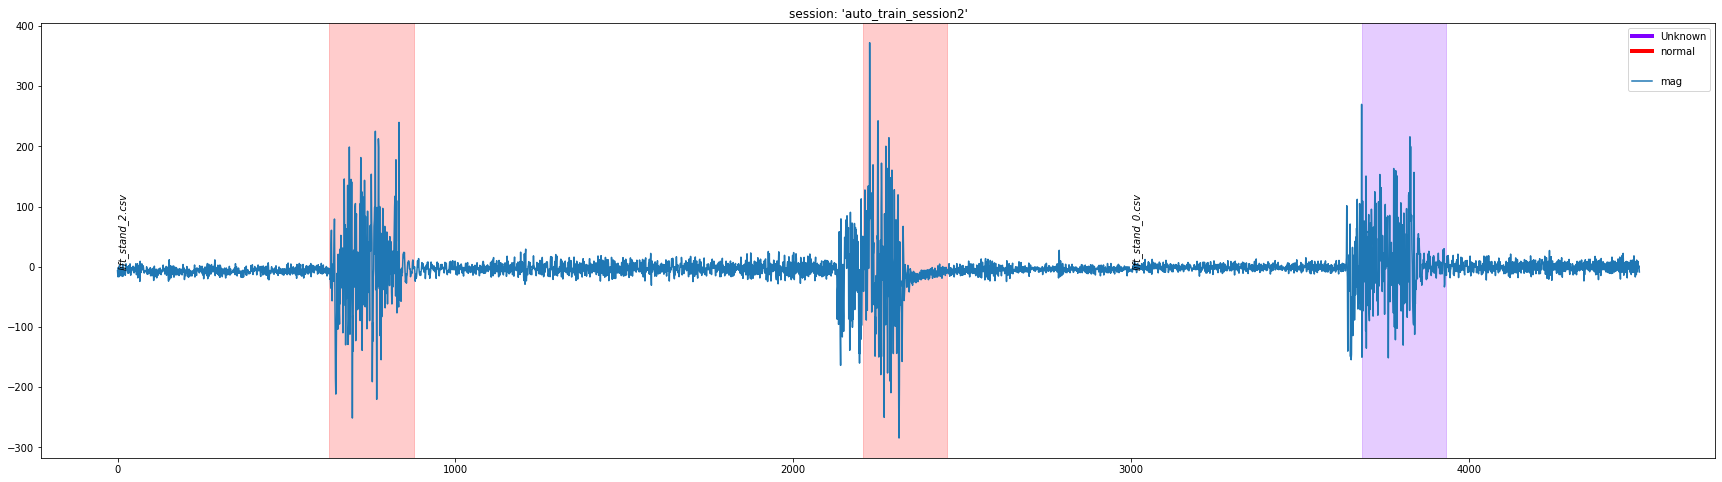
df = dcl.plot_segment_labels(["lift_stand_2.csv", "lift_stand_0.csv"], "auto_train_session2", transforms=[mag_columns_def, scale_columns_def], columns=['mag'])
Converting a CSV to DCLI
You can convert a .CSV file into a .DCLI file that can be imported into the Data Studio by using the csv_to_dcli API
- sensiml.dclproj.csv_to_dcli.to_dcli(df, label_column, filename, session_name=None, outdir='dcli_export', sensor_columns=None, video_name=None, metadata=None, exclude_labels=None, export_dcli=True, export_csv=True, dcli_name='export.dcli', verbose=True)
This is used to convert a CSV file into a dcli file that can be imported into the DCL
The expected format of a CSV file for this converter is a CSV containing all of the sensor data as well as a column that specifies which label each row corresponds to
Sensor1,Sensor2,…SensorN,Label 13,134,…,146,Running 42,124,…,123,Running 13,342,…,124,Running 12,134,…,123,Running 15,121,…,124,Walking 19,134,…,134,Walking . . . 19,134,…,134,Walking
- Parameters
df (dataframe) –
label_column – the label column to use for adding segments
filename – the name of the file
session_name – The session name to use when creating the session for import
outdir – the directory to write the exported data to
sensor_columns (list) – the column in the DataFrame that are sensor columns, if None use all columns except the label column
video_name (str) – path to the video associated with this file
metadata (list) – metadata already formatted in the dcli format
exclude_labels (list) – labels to exclude when creating this file
export_dcli (bool) – creates the dcli file in the outdir folder
export_csv (bool) – copies the dataframe of sensor data to the the outdir folder
dcli_name (str) – name of the .dcli file to create
The DCLProject class provides read-only access to the .dclproj file that is associated with a Data Capture Lab project. The are a number of helper functions for visualizations and queries.
dclproj_path = ‘<PATH-To-File.dclproj>’
dcl = DCLProject(path=dclproj_path)
- sensiml.dclproj.dclproj.DCLProject.create_connection(self, db_file: str) None
create a database connection to the SQLite database specified by db_file
- Parameters
db_file – database file
- Returns
None
- sensiml.dclproj.dclproj.DCLProject.get_capture(self, capture_name: str) DataFrame
Returns the capture as a DataFrame
- Parameters
capture_name (str) – name of capture
- sensiml.dclproj.dclproj.DCLProject.get_capture_metadata(self, capture: Optional[str] = None, include_ids: bool = False) DataFrame
Gets the metadata for the specified capture
- Parameters
capture (str) – name of the capture file
- Returns
DataFrame containing the metadata associated with this capture
- Return type
DataFrame
- sensiml.dclproj.dclproj.DCLProject.get_capture_segments(self, captures: Optional[List] = None, sessions: Optional[List] = None)
Returns a DataSegment object of the specified capture and session
- Parameters
capture_name (str) – name of capture
session (str) – name of session where the labels are
- sensiml.dclproj.dclproj.DCLProject.get_captures(self, capture_names: Optional[List[str]] = None) DataFrame
Returns the capture as a list of dataframes
- Parameters
capture_names (List[str]) – name of captures to return, if None returns all captures
- sensiml.dclproj.dclproj.DCLProject.get_segments(self, sessions: Optional[List] = None)
Returns a DataSegment object of the specified session
- Parameters
session (str) – name of session where the labels are
- sensiml.dclproj.dclproj.DCLProject.list_capture_segments(self, captures: Optional[List] = None, sessions: Optional[List] = None, include_ids: bool = False) DataFrame
Returns a DataFrame of segment information that are in the captures and sessions specified
- Parameters
captures (Optional[List], optional) – A list of captures to return segments about. Defaults to None.
sessions (Optional[List], optional) – A list of sessions to return segments for. Defaults to None.
- Return type
DataFrame
- sensiml.dclproj.dclproj.DCLProject.list_captures(self, include_metadata: bool = True) DataFrame
List the captures in the DCLI project file
- Parameters
include_metadata (bool, optional) – If True return the associated metadata information with each capture. Defaults to True.
- Returns
DataFrame containing the capture information
- Return type
DataFrame
- sensiml.dclproj.dclproj.DCLProject.plot_segment_labels(self, capture_names: List[str], session: str, columns: Optional[List[str]] = None, transforms: Optional[List[Dict]] = None, figsize: Tuple = (30, 8), ylim: Optional[Tuple] = None, xlim: Optional[Tuple] = None) None
Creates a plot of the labels and raw signal data for a session and one or more capture files.
- Parameters
capture_names (List[str]) – List if captures to plot
session (str) – name of session to pull the labels from
columns (list) – a list of columns to plot from the data label the value is the label it was should be renamed to
transforms – additional fucntions to apply prior to plotting the data
Examples
>>> def sum_columns(x):
>>>     return x[['Column1', 'Column2']].sum()
>>> func = {'name':'sum','func':sum_columns, 'type':'transform'}
>>> dcl.plot_segment_labels(captures, session_name, columns=['sum'], transforms=[func])
>>> # example of multiple transforms executed in order
>>> def sum_columns(x):
>>>     return x[['Column1', 'Column2']].sum()
>>> def remove_offset(x):
>>>    x['Column1']-=100
>>>    x['Column2']-=200
>>>    return x
>>> func2 = {'name':'filter','func':remove_offset, "type":'filter', "columns":['Column1', 'Column2']}
>>> func1 = {'name':'sum','func':sum_columns, "type":'transform'}
>>> dcl.plot_segment_labels(captures, session_name, columns=['Column1', 'Column2', 'sum'], transforms=[func1, func2])