Segmentation Parameter Selection
Many of the segmentation algorithms work by identifying a threshold level above which the start or end of a segment is triggered. Identifying the correct threshold for a dataset can be challenging. The Toolkit has some built in heuristics for identifying the best parameters for some of the segmentation algorithms. In some cases though, you may want to select the parameters manually. This tutorial will show you how to use the Python SDK to select good parameters
Try It Yourself
You can download the Notebook file here to follow along with this tutorial in your own environment.
Prerequisites
Download the Demo Project and extract into this folder
Update to the latest SensiML Python SDK
To see the visualizations install ipywidgets
[ ]:
!pip install ipywidgets sensiml -U
Overview
In this tutorial we will
Load a .DCLPROJ file into the Python SDK using the DCLProject API
Upload a .DCLPROJ file as a new project to the server using the Client
Visualize the threshold space for segmentation algorithms and select an appropriate threshold
Run the Segmentation algorithm and compare the generated segments to the ground truth
Compare the generated segments to the manually labeled segments
[2]:
from sensiml import Client
from sensiml.dclproj import DCLProject, plot_threshold_space, DataSegments, segment_list_to_datasegments
1 Load a .DCLPROJ file into the Python SDK using the DCLProject API
The DCLProject API provides read-only access to a .DCLPROJ file which is the native database of a Data Studio project. To load the project
[3]:
DCLP_PROJECT_PATH = "DemoProject/DemoProject.dclproj"

dcl = DCLProject(path=DCLP_PROJECT_PATH)
2 Upload a .DCLPROJ file using the Python SDK Client
You can use the client to upload either a .DCLPROJ or .DCLI file. The .DCLPROJ format is a database format used by the Data Studio. The .DCLI file is a JSON format is open sourced which also fully describes the project. You can read more about the .DCLI format in our documentation. For this example we will use the .DCLPROJ format.
[4]:
client = Client()

client.upload_project("Segment Demo Project", DCLP_PROJECT_PATH)
client.project = "Segment Demo Project"
Project with this name already exists.
select and set the variables for the GROUND_TRUTH_SESSION, PREDICTED_SESSION, and FILENAME from the .dcproj database
[5]:
client.list_captures()
[5]:
| Name | Last Modified | Created | UUID | |
|---|---|---|---|---|
| 0 | File1.csv | 2023-02-24T20:13:25.553485Z | 2023-02-24T20:13:25.553485Z | a877cc1f-ce30-44c8-b345-f35daa83939c |
[ ]:
client.list_segmenters()[["name","custom","created_at"]]
[7]:
GROUND_TRUTH_SESSION = "Training Session"
FILENAME="File1.csv"
3 Visualize the threshold space for segmentation algorithms and select an appropriate threshold
threshold_width is the region the threshold space is calculated over.
threshold type is the type of calculation performed on sensor data within that region. The values of the threshold type are (absolute sum, sum, variance, std)
column_of_interest is the column of sensor data used to compare against the threshold
The larger the threshold width the less sensitive to noise the threshold will be, but the slower it will be to trigger. Select different parameters below to see how it affects the threshold space.
[8]:
threshold_width=15 # threshold
threshold_type='std' #"absolute sum", "std", "variance"

capture = dcl.get_capture(FILENAME)
gt_segs = dcl.get_capture_segments(FILENAME, GROUND_TRUTH_SESSION)

sensor_columns_to_use = ['AccelerometerZ', 'GyroscopeX'] #'AccelerometerX', 'AccelerometerY', 'GyroscopeY', 'GyroscopeZ'

for column_of_interest in sensor_columns_to_use:
    plot_threshold_space(capture, column_of_interest, gt_segs, threshold_type=threshold_type, threshold_width=threshold_width)
4 Run the Segmentation algorithm and compare the generated segments to the ground truth
In the following cell the Windowing Threshold Segmentation algorithm is used as the segmentation algorithm with the input parameters:
column_of_interest: AccelerometerZ
threshold_space_width 15
threshold_space std
The function will execute a pipeline job in the cloud and return the results which are converted into a DataSegments Obj
[9]:
client.pipeline="Segmenter Pipeline"

client.pipeline.reset()
client.pipeline.set_input_capture([FILENAME])

# Set the Windowing Threshold to the values you would like to have in the segmenter algorithm
client.pipeline.add_transform("Windowing Threshold Segmentation", params={"column_of_interest": 'AccelerometerZ',
                                "window_size": 100,
                                "offset": 50,
                                "vt_threshold": 10000,
                                "threshold_space_width": 15,
                                "comparison": "maximum", #options: <maximum/minimum>,
                                "threshold_space": "std", #options: <std/absolute sum/sum/variance/absolute avg>,
                                "return_segment_index": True,
                                })

r,s = client.pipeline.execute()
new_segs  = segment_list_to_datasegments(r).nearest_labels(gt_segs, verbose=False)
Capture files do not have group columns, use a data file if you need group columns.
Executing Pipeline with Steps:

------------------------------------------------------------------------
 0.     Name: File1.csv                                 Type: capturefile
------------------------------------------------------------------------
------------------------------------------------------------------------
 1.     Name: Windowing Threshold Segmentation          Type: segmenter
------------------------------------------------------------------------
------------------------------------------------------------------------


Results Retrieved... Execution Time: 0 min. 0 sec.
5 Compare the generated segments to the manually labled ground truth
The DataSegments obj has a number of APIs which are very useful for manipulating, visualizing, and comparing segments. To see a comparison between the ground truth segments and the predicted segments use the confusion_matrix API
[10]:
new_segs.confusion_matrix(gt_segs)
Pred Session:
Model:
-----------  ---------  ---------  ---  -------  -------
             Gesture A  Gesture B  UNK  Support  Sense %
Gesture A            7          0    0        7    100.0
Gesture B            0          9    1       10     90.0
UNK                  0          0    0        0        0
-----------  ---------  ---------  ---  -------  -------
Total                7          9    1       17
Pos_Pred(%)      100.0      100.0    0   Acc(%)    94.12
-----------  ---------  ---------  ---  -------  -------
[10]:
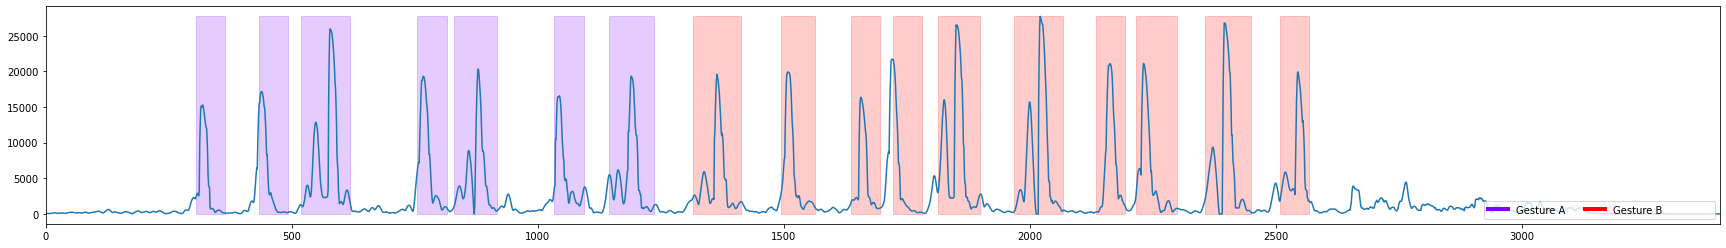
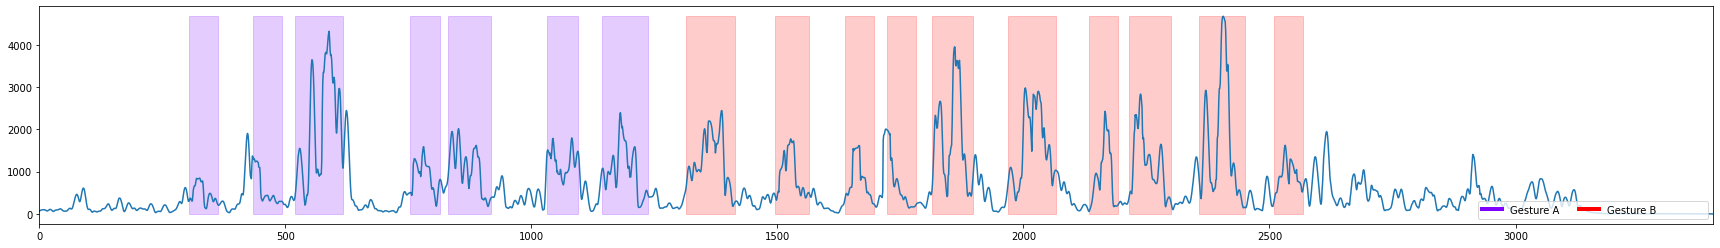
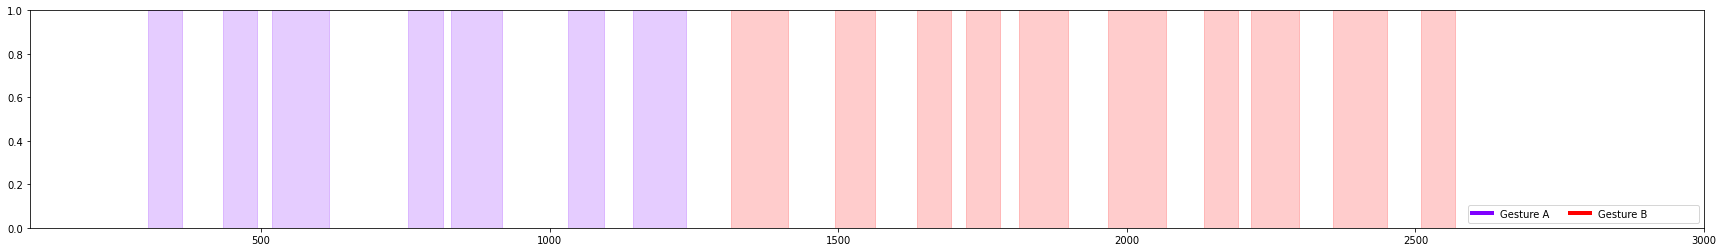
You can also use the DataSegments plot_segments API to plot only the labels directly from a DataSegments object.
[28]:
xlim=(100,3000)
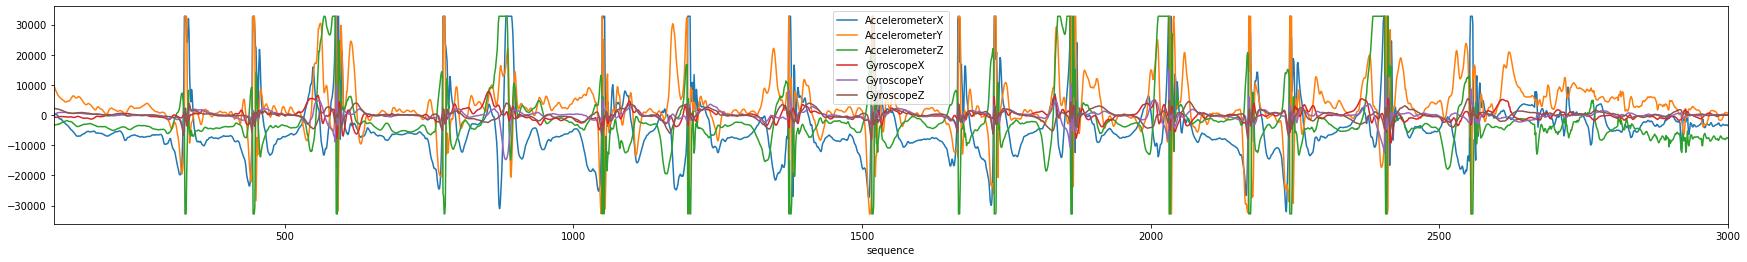
ax = capture.plot(figsize=(16,4), xlim=xlim)
print("Predicted")
new_segs.plot_segments(figsize=(16,4), xlim=xlim)
print("Ground Truth")
gt_segs.plot_segments(figsize=(16,4), labels=new_segs.label_values, xlim=xlim)
Predicted
Ground Truth
This tutorial has demonstrated how to select parameters for the Segmentation algorithms by created a plot that transforms the sensor data into the threshold space. You can use this to select the parameters for your own segmentation algorithms.