Profiling Model Performance
SensiML offers the option to profile model performance directly on a device. Profiling will give the latency information for each feature generator and classifier running in your model.
This lets you see exactly how your model is running and helps you decide which feature generators to be included in a model to conserve space or execution time.
Important
Profiling is only enabled for x86 and Arm Cortex processors with the DWT_CYCCNT registers available.
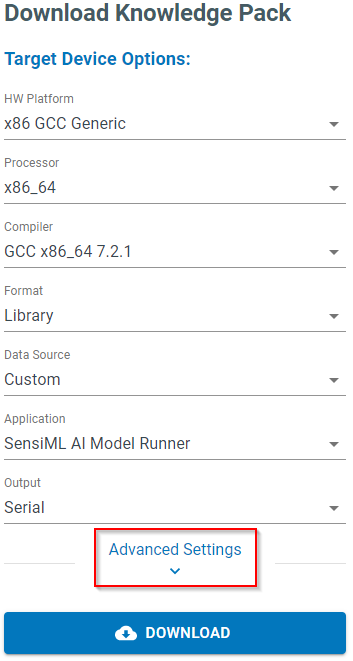
Downloading a Knowledge Pack with Profiling Enabled
Expand Advanced Settings in the Download Model screen
Set Debug and Profile to True
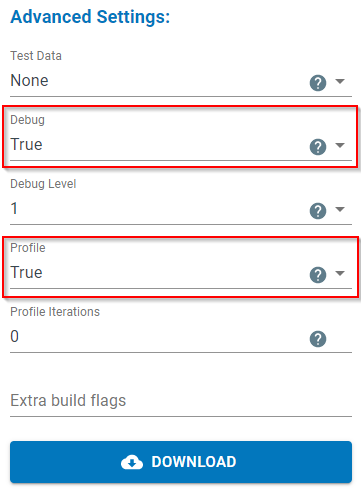
This will download a Knowledge Pack with profiling enabled, allowing the output to be viewed in the serial output from the device.
Viewing Profile Information
The SensiML Python SDK has a profile parser that will connect to the device and run through a number of classifications to give an average of each feature generator. A file called model.json will be downloaded with your Knowledge Pack. You can set this path when viewing profile information.
Note
Installation instructions for the SensiML Python SDK can be found in the SensiML Python SDK Documentation.
from sensiml.profile import ProfileParser

def run_profile(com_port="/dev/ttyACM0", run_count=100, model_json_path="MODEL_JSON_PATH", baud_rate=921600):
    parser = ProfileParser(
        port=com_port, num_msgs=run_count, json_path=model_json_path, baud=baud_rate
    )
    parser.run()
    return parser
This will return a ProfileParser object that can be output in YAML, JSON, or as a python dictionary. Here is a YAML example:
ClassifierAverageCycles:
    - PME: 15959
FeatureCyclesPerInference:
    - Mean Crossing Rate: 16768
    - Mean Difference: 14270
    - Second Sigma Crossing Rate: 27372
    - Sigma Crossing Rate: 28443
    - Threshold Crossing Rate: 16932
    - Threshold With Offset Crossing Rate: 29295
    - Zero Crossing Rate: 17846
RunCount: 100
To view the cycle count for features:
profile = run_profile(com_port="/dev/ttyACM0", run_count=100, model_json_path="MODEL_JSON_PATH", baud_rate=921600)

print(profile.combined_metrics["FeatureCyclesPerInference"])
This will give the total cycles for each feature in a model. To get measured CPU time, divide this number by the clock frequency your device runs at.
To view the cycle count for classifiers:
profile = run_profile(com_port="/dev/ttyACM0", run_count=100, model_json_path="MODEL_JSON_PATH", baud_rate=921600)

print(profile.combined_metrics["ClassifierAverageCycles"])
This will give the total cycles for each classifier in a model. To get measured CPU time, divide this number by the clock frequency your device runs at.